Chapter 3 Data for SDI
Data is a cornerstone of marine spatial planning (MSP), driving resource management, decision-making and strategic planning. Spatial data infrastructures (SDI) must contend with diverse data types, and thus a high degree of data fluency is needed by those creating them. This chapter explains different aspects of data relevant to the creation and operation of SDIs, beginning with an exploration of subject data (i.e. data that is about a given entity: its subject) and metadata (i.e. data which has other data as a subject), which form the building blocks of any data system. It then follows on with the principles of data architecture, highlighting the importance of designing robust frameworks for managing and organising data. Finally, the chapter concludes with recommended practices for data management, offering practical guidelines to verify data is accurate, accessible, and effectively used.
3.1 Data fundamentals: Subject data and metadata
3.1.1 Subject data
The importance of data in MSP
In order to work as an effective planning instrument, MSP requires data that can help organise the multiple uses of the maritime space in ways that balances ecological, economic, and social objectives.
Data sharing supports coordinated efforts between stakeholders minimising conflicts and offering opportunity for multi-use of space. Data also helps comply with regulations and international agreements, ensuring legal and responsible use of maritime resources.
Different types of MSP data
Within the context of MSP, input and output data terms started to be used by the HELCOM-VASAB4 MSP Data Expert Sub-Group5, serving different purposes within the planning and decision-making process.
Input data refers to the data collected from various sources that are used in an MSP process or SDI. Examples of input data include water quality indicator values, temperature values, species distribution tables, habitat maps, polygons delimiting fishing areas, shipping routes, socio-economic data in categorical and numeric form, or regulatory and policy data in tabular or attribute format of the boundaries.
Output data refers to the data generated from the processing of the input data through various workflows in the SDI. This includes data and information products such as the integrated spatial information resources that were created using input data. The output data of an SDI (including the data products that encapsulate it) provide the basis for regulatory measures, and for communication tools to show the result of the planning process to stakeholders and decision-makers, such as the European MSP data layer created by the European Marine Observation and Data Network (EMODnet) (Box 6). The quality of output MSP data depends on the comprehensiveness and availability of input data, as well as the quality of the processing inside an SDI.
Case Study
Box 6: The European Marine Observation and Data Network (EMODnet) output MSP data layer
Contributed by Manuel Frias
An example of output data is the European MSP data layer, which has implemented the FAIR principles following extensive stakeholder consultation and is publicly accessible on the European Marine Observation and Data Network (EMODnet). This data product comprises European maritime spatial plans that apply the MSP EMODnet data model developed by the Technical Expert Group on Data for MSP (Box 7). The applied standard is documented in the Proposal for Making Harmonized MSP Plan Data Available Across Europe6 , which results from the technical solution based on the MSP INSPIRE data model and HELCOM-VASAB Basemaps7. Further, EMODnet is a partner in the ODIS Federation8, and thus its products are also discoverable through more global FAIR implementations9, aligned with the UN Ocean Decade’s Data and Information Strategy.

Figure 11: Example of harmonised output data in the EMODnet map viewer.
© EMODnet (*)
Box 7: The European Commission’s Technical Expert Group (TEG) on Data for Maritime Spatial Planning
The European Commission’s Technical Expert Group on Data for Maritime Spatial Planning (TEG)10was established in 2020 by the Directorate-General for Maritime Affairs and Fisheries (DG MARE) and the European Climate, Infrastructure and Environment Executive Agency (CINEA). The TEG was established as part of the European Union's efforts to address the growing need for standardised and high-quality data in managing marine spaces, resolve ongoing issues, improve data accessibility and sharing, support consistency in the data used for MSP processes, and facilitate the exchange of knowledge and experience between practitioners and experts on MSP.
Since the establishment of the TEG, the voluntary members of the TEG have identified priority areas where intervention was required and established a number of dedicated technical sub-groups to develop guidance, standards and in some cases data models to address these challenges.
The TEG plays a key role in improving data sharing and management practices across EU Member States to support MSP. Composed of experts from various sectors, the TEG focuses on creating guidelines and standards for data interoperability, quality, and accessibility, enabling consistent and informed decision-making in the management of marine spaces.
Finding data that suits a particular MSP is one of the first challenges MSP practitioners face. The MSP Data Framework, co-developed by the TEG, is a data framework to guide what types of data should be collected and included in suitability analysis for zoning economic activities and cumulative impact assessments. This framework identifies the relevant maritime and coastal use data required.
How to structure input data
Input data collection for MSP needs to be structured such that the digital representation of the marine and coastal regions of interest is systematically and professionally achieved. A data collection plan is needed during the development of the work plan (see Chapter 2, Task 7). Additionally, defining data types, categories and protocols (see Chapter 3.2) is necessary to build an information system. This system will effectively organise the data used as inputs for analyses required to support informed and science-based decisions within the planning (UNESCO-IOC and European Commission, 2021).
A data framework provides guidance for collecting and structuring data necessary for effective marine spatial planning. Carefully clustering data flows according to the priorities of a region or stakeholder community can elucidate their priorities and help identify gaps.
The data framework also serves to support the harmonisation of data across different initiatives, improving interoperability, and consistency. Such a structured approach, if it is tuned to the capabilities of the observing and data systems in the regions of interest, enhances the analytical potential and comparability of results, supporting robust decision-making and fostering cross-border cooperation. Additionally, frameworks lay the groundwork for monitoring and evaluating spatial plans, ensuring that data aligns with monitoring objectives. For example, the Maritime Spatial Planning Data Framework (MSPdF) provides such guidance from a European perspective (Box 8).
Box 8: The EU Maritime Spatial Planning Data Framework (MSPdF) as an example of how to structure data in the Spatial Data Infrastructure
To encourage a structured MSP data collection and to facilitate defining the categories for organising the data, the European Commission’s Technical Expert Group (TEG) on data for MSP delivered a framework on input data titled: “Maritime Spatial Planning Data Framework (MSPdF), How to structure input data for MSP process, monitoring & evaluation” (Abramic et al., 2023). MSPdF consists of seven thematic clusters that include seven check lists with data topics to be considered if required for MSP objectivities particular to a given situation. MSPdF considers the marine and coastal areas and covers various clusters of data related to:
Marine and Coastal Environment: This cluster focuses on spatial information related to the marine and coastal environment. It includes data on environmental factors relevant to spatial planning including biodiversity and ecological processes.
Marine & Coastal Conservation and Designated Sites: It covers data related to conservation areas, protected sites, and other designations related to the environmental risks, security and safety. These data help verify that planning considers boundaries of ecological and conservation aspects already defined.
Oceanographic Characteristics and Climate: This cluster deals with oceanographic data, crucial for effective spatial planning and considering climate change in the area of planning. Parameters considered under this data cluster include physical, biogeochemical and biological aspects not included in the first cluster.
Coastal Land Use and Planning: Coastal land use data (terrestrial part of the coastal zone) provide insights into human activities necessary for the Land-Sea Interactions analyses, avoiding conflicts and searching for the compatibilities within coastal and maritime development. This data cluster may include land use maps and zoning plans, infrastructure data such as ports, coastal roads, railways or piers, urban development data, cultural data such as information on traditional land-use practices or Indigenous and local knowledge related to the coast, or locations of culturally or historically significant coastal sites.
Operative Maritime Activities and Maritime Spatial Planning: Data on existing and planned maritime activities (maritime part of the coastal zone and offshore) to verify that spatial plans accommodate operative and planned activities.
Socio-Economic Information: This cluster includes data on economic activities, employment, tourism, and other socio-economic factors. Socio-economic data can be divided into two main data categories, socio-demographic data characterising the human population, and economic data characterising the coastal and ocean economy as well as jobs and income related to coastal and maritime sectors. Such data includes GDP estimates, employment data, details on wages/income and number of businesses, and is often provided through statistical offices. It helps assess the impact of spatial planning decisions on local communities.
Governance Information: Governance data cover legal frameworks that apply to the area of the planning, including the boundaries under each administrative competence with the operative sectors and planning area, including institutional arrangements. Understanding governance structures is essential for effective implementation of spatial plans. Governance information may include a variety of data types and resources such as legal documents, jurisdictional maps, institutional arrangements, policy and planning documents, sectoral regulatory framework and boundaries, and potential conflict data (conflicting legal claims, historical disputes etc.).
Within the data framework, data need to be organised into well-structured categories to support clarity and interoperability. Data categories should be customised to allow for the integration of region-specific data and facilitate transboundary collaboration, meeting the unique ecological, cultural, and economic needs of each region.
Taking the EU MSPdF (Box 8) as starting point, the following key data categories for SDI are proposed:
(i) Biology and Ecology: Documents biodiversity, habitats, and ecological patterns such as species distributions, habitats (e.g., coral reefs, seagrass meadows, kelp forests), migratory routes, spawning areas, invasive species data.
(ii) Physical Oceanography: Monitors and models physical characteristics and processes of the ocean such as water temperature, salinity, ocean currents, wave height, tides, ocean circulation patterns.
(iii) Chemical Oceanography: Tracks chemical properties of seawater to understand ocean health and biogeochemical cycles. This includes pH levels, dissolved oxygen, nutrients (nitrates, phosphates), pollutants (e.g., heavy metals, plastics), carbon content.
(iv) Bathymetry and Geophysical data: Provides mapping of underwater terrain and physical characteristics of the seafloor, such as seafloor topography, substrate type, sediment types, geomorphology.
(v) Climate & Ocean Health Indicators: Monitors long-term environmental trends affecting the marine ecosystem, such as sea level rise, sea surface temperature anomalies, ocean acidification, hypoxic zones, coral bleaching events, habitat degradation indicators, ice cover extent.
(vi) Human Activities & Infrastructure: Documents human use of marine areas and infrastructure placement, including shipping lanes, fishing areas, aquaculture farms, offshore oil and gas installations, renewable energy sites (e.g., wind farms), underwater cables, ports, etc.
(vii) Management Areas: Provides information on designated areas for conservation and regulated activities. This includes MPAs, no-take zones, Exclusive Economic Zones, territorial waters, fisheries management zones.
(viii) Socio-economic data: Provides data on the economic and social aspects of marine resources and coastal communities, such as coastal population density, fisheries economic data, tourism statistics, livelihoods of marine-dependent communities
.(ix) Hazards & Pollution: Identifies natural and anthropogenic hazards affecting marine environments, which may include pollution hotspots related to oil spills, plastics, nutrient runoff, harmful algal blooms, storm surge data, tsunamis, hurricane paths, seismic activity, underwater landslides.
(x) Policy, Governance & Legal Framework: Outlines policy guidelines, regulatory frameworks, and governance structures related to marine areas. This refers to marine policy documents, zoning regulations, legal jurisdictions, international agreements, compliance areas, administrative boundaries.
Determining the number of data categories requires balancing user needs, system goals, and available resources. Adding more categories enhances data granularity and specificity, which can improve user efficiency, support detailed analysis, and address specialised needs. However, this also increases complexity in data management, raises the risk of redundancy and overlap between similar categories, and demands more storage and processing resources due to larger metadata volumes and potential cross-referencing and harmonisation between categories.
The Global Ocean Observation System (GOOS) has defined a set of Essential Ocean Variables (EOVs)11 to monitor and understand the state of the ocean in terms of physics, biogeochemistry, biology and ecosystems (Figure 12, Box 9). These EOVs can provide guidance of which key oceanographic and biological variables to include in the respective data clusters of a data framework for MSP.

Figure 12: Essential Ocean Variables as characterized by the GOOS expert panels.
© GOOS (*)
Box 9: Essential Ocean Variables (EOVs) by the Global Ocean Observation System (GOOS)
Essential Ocean Variables (EOVs) have been identified by the Global Ocean Observing System (GOOS) as priority variables to monitor and understand the state and variability of the global ocean. They encompass critical parameters focussing on ocean processes such as water temperature, salinity, ocean currents, oxygen and carbon dioxide levels and biological indicators such as species distribution. These variables are selected based on their trans-regional relevance to climate, marine ecosystem health, and human activities, and for assessing changes in the ocean's physical, chemical, and biological processes. By consistently monitoring these variables, scientists can detect trends, such as ocean warming, acidification, or shifts in marine ecosystems, that are required for the effective management of ocean resources and responding to climate change.
The EOV framework promotes a standardised approach for global ocean observation, and thus more comparable data across regions. This system is a mechanism to enhance coordination among research institutions, governments, and international organisations, helping to fill gaps in knowledge and address issues like ocean health, marine biodiversity loss, and the effects of human activities on marine systems.
The MSPglobal Data Toolbox “How to use ocean observation for MSP” (UNESCO-IOC, 2025)12provides more details about EOVs and how to access and use ocean observation data in the context of MSP.
Addressing data uncertainties to enhance the decision-making process
Data uncertainty refers to the inherent variability and potential inaccuracies in data, which can affect the reliability of analyses and decision-making. Systematically detecting and quantifying these uncertainties is essential for assessing the reliability of input data and establishing confidence in the results and conclusions derived from statistical analysis. Addressing and communicating data uncertainty is a key component of good practices in data management, as outlined in Chapter 3.3.2.
In marine spatial data, data uncertainty plays a significant role, as marine environments are complex, dynamic, and often difficult to measure with complete accuracy. Uncertainties need to be addressed to enhance the decision-making and to achieve a more effective and resilient MSP. Acknowledging uncertainties supports adaptive management, guiding further data collection and monitoring efforts. Transparency about uncertainties builds stakeholder trust and fosters collaboration.
How to detect and quantify uncertainty
Uncertainty quantification of data involves evaluating the methods, instruments, and conditions used during data collection to determine how much a given measurement may vary from the true value. This assessment typically includes performing error calculations to measure deviations between observed values and established standards or expected values. For example, bathymetric data collected through sonar may have different uncertainty levels compared to data from satellite altimetry, and quantifying this helps users understand potential limitations.
Quantifying uncertainty in input data involves assessing several key elements:
Measurement error: This encompasses any deviation of the measured value from the true value, arising from limitations in sensors or instruments, or variations in sensor calibrations, which may produce inaccurate readings.
Measurement uncertainty: Beyond the measurement error, this quantifies the doubt about the result of a measurement, often expressed as a range or confidence interval.
Noise: Noise refers to random variations that can obscure true signals in data and lead to inconsistent measurements.
Statistical error or deviation: This type of error reflects the natural variability within the data, often expressed through metrics like standard deviation.
Systematic bias: This is a consistent skew caused by predictable factors, such as biases in sampling methods or equipment, leading to consistently inaccurate measurements in one direction.
Calculation error: This refers to errors occurring when processing steps introduce inaccuracies, particularly in complex calculations or model outputs.
In addition to uncertainty quantification, variation detection over time or across different sources allows identifying inconsistencies or trends that could signify either true changes in the data or errors in collection or processing. Detecting variation in marine spatial data helps distinguish between real environmental changes, such as shifting ocean currents or habitat boundaries, and data inconsistencies.
The benefits of incorporating uncertainty data layers
Geospatial data often comes with uncertainty layers that quantify and visualise the degree of uncertainty associated with specific measurements or predictions. These layers provide information about the reliability of the underlying data, helping users assess the confidence that can be placed in spatial analyses. Uncertainty layers are often visualised using colour gradients or contour lines to depict areas of high and low uncertainty, allowing users to easily identify regions that may require cautious interpretation or additional validation.
Uncertainty layers in spatial data usually capture various types of uncertainty, including:
Measurement Uncertainty: This reflects the possible deviations in data due to limitations in the measurement process, such as sensor accuracy or calibration issues.
Spatial Uncertainty: This indicates how accurately the geographic location of features is represented by the geographical coordinates, often due to positional errors or the scale of data collection.
Temporal Uncertainty: This addresses the reliability of data over time, particularly important for dynamic phenomena such as climate change or habitat shifts.
Model Uncertainty: This captures the uncertainties arising from predictive models, including assumptions made during modelling and variations in input data.
While data from larger providers typically include uncertainty layers, self-collected data or data from small organisations often lack such uncertainty assessments. It is important to complete such data with uncertainty information, either as metadata descriptors reflecting data quality metrics or limitations, or as uncertainty data layers.
The process of producing uncertainty data layers involves the following steps:
Quantify uncertainty: Use statistical methods to quantify uncertainty of each data point, including confidence intervals, standard deviations or error margins based on the identified sources of uncertainty, as described above.
Create an uncertainty model: Develop a model that integrates the quantified uncertainties, either by assigning uncertainty values to each data point, or using geostatistical methods such as kriging13 to interpolate uncertainty across the sampling area.
Produce the uncertainty data layer: Use GIS software or scripting to create a new data layer that visualises areas with high and low uncertainty.
Validation and testing: Validate the uncertainty layer by comparing it with independent datasets or conducting expert review. Adjust the model as necessary.
Documentation: Document the methods and assumptions used to create the uncertainty layer, including details on how uncertainty was quantified and modelled, to provide for transparency and reproducibility.
The importance of communicating uncertainty
Communicating quantified uncertainties to end users is important for enabling them to incorporate this understanding into their analyses and decision-making processes. Particularly in cases involving multiple data streams and their interactions, creating a simplified synthesis layer provides a clear overview of uncertainty across diverse datasets, which is beneficial for answering the question “How confident can I be in trusting this data?”.
To increase accessibility of data uncertainty to end users, consider the following key aspects:
Simplified Visualisation: Create an additional synthesis data layer that visually represents uncertainty using clear and intuitive formats, such as colour gradients, shading, or contour lines. This helps users quickly grasp areas of high and low uncertainty.
Clear Legend and Labels: Provide a concise legend and clear labels that explain the meaning of different colours or symbols used in the uncertainty layer.
Contextual Information: Include context about the sources of uncertainty, such as measurement errors or sampling biases. Brief explanations can help users understand why uncertainty exists and its potential implications for decision-making.
User-Friendly Language: Use simple, non-technical language to describe uncertainty concepts. Avoid jargon to make sure that all users, regardless of their expertise, can comprehend the information.
Documentation and Examples: Provide supplementary documentation or case studies that illustrate how uncertainty impacts data interpretation and decision-making. Real-world examples can help users relate to the concept of uncertainty in their own contexts.

©Worawut Prasuwan/Getty Images
Harmonisation of data format and visualisation symbols
Harmonisation of MSP data format and symbology facilitates datasets from multiple sources to be integrated and understood consistently across different systems and stakeholders. Establishing consistent standards for data types, encoding and visual representation supports seamless data exchange and comparison across various jurisdictions and platforms.
In MSP, two distinct challenges emerge: harmonising the format and graphical representation of both input and output data across borders. For example, plans from different countries are difficult to compare if they lack consistent structure and symbology.
Harmonisation of data formats
Achieving harmonised input data remains a significant challenge. Input data is often scattered across numerous sources and lacking consistency in format and structure. This inconsistency requires time-consuming harmonisation efforts by MSP practitioners before the data can be effectively utilised within MSP processes. Unfortunately, no universally agreed-upon standard exists yet for input data harmonisation at the international level. This lack of consensus can hinder initiatives aimed at standardising data representation.
However, it is important to acknowledge ongoing efforts towards harmonising MSP output data. Several resources already available for this purpose include the Proposal for making harmonised MSP plan data available across Europe, the Guidelines on transboundary MSP output data structure in the Baltic Sea14, and the Data specification for maritime spatial planning inspire data from the MarSP project15. The S-100 framework developed by the International Hydrographic Organization (IHO) (Box 9) supports the integration of various data types and enhances the exchange and interoperability of maritime data, including providing standardised guidelines for data encoding. Recent European initiatives, such as Baltic Sea2Land16 or ReMAP17, have begun to harmonise MSP input data, setting groundwork for more cohesive MSP input data standards.
These guides and frameworks provide valuable recommendations for structuring and presenting MSP output data consistently facilitating easier comparison of plans across regions, fostering collaboration and knowledge exchange within the global MSP community.
Harmonisation of symbology
Data representation in an MSP context focuses on accurately and consistently communicating spatial information to support analysis and decision-making among stakeholders. Effective data representation allows stakeholders to visualise, interact with, and better understand the data, making complex datasets more accessible, actionable, and easy to share.
Describing symbology standards for actual data representation involves specifying the visual and structural conventions used to convey information within maps or spatial data. This includes:
Character Sets: Defining the symbols, letters, or icons used to represent different features, such as specific icons for ports, fishing zones, or protected areas. This promotes consistency and recognizability across different datasets and platforms.
Semiotics: Establishing the meaning of symbols and colours (e.g., blue for water features, red for restricted areas), so that users intuitively understand what each symbol represents. This includes cultural or conventional meanings associated with colours and shapes.
Syntax: Outlining rules for symbol arrangement and layering, such as which symbols should appear in the foreground and how overlapping features are displayed, to maintain clarity and readability.
Symbology harmonisation supports representing complex spatial data in a standardised way, enabling users to interpret information accurately and efficiently across different maps and systems.
International harmonisation initiatives
In some MSP European projects and within the International Hydrographic Organisation (IHO) working group, proactive measures have been initiated to address challenges related to symbology and content harmonisation (Box 10), recognizing the importance of standardised representation for effective data communication (Delaroche et al., 2024).
Box 10: Contributions to data representations from the International Hydrographic Organization
The recent S-100 standard18 from the International Hydrographic Organization (IHO) stands out as a key reference, encompassing both the data currently used in the day-to-day operations (e.g. maritime traffic management) and emerging standards (Figure 13). It serves as a framework for data formats and interoperability while also standardising the visual representation of that data. This dual focus is intended to promote consistent, accurate, and effective communication of maritime information across different applications and stakeholders.
The focus of a symbology standard system developed for the S-100 is to globally standardise the representation of Marine Protected Areas (MPA) and other Managed Area data, with a particular emphasis on restrictions on human activities.
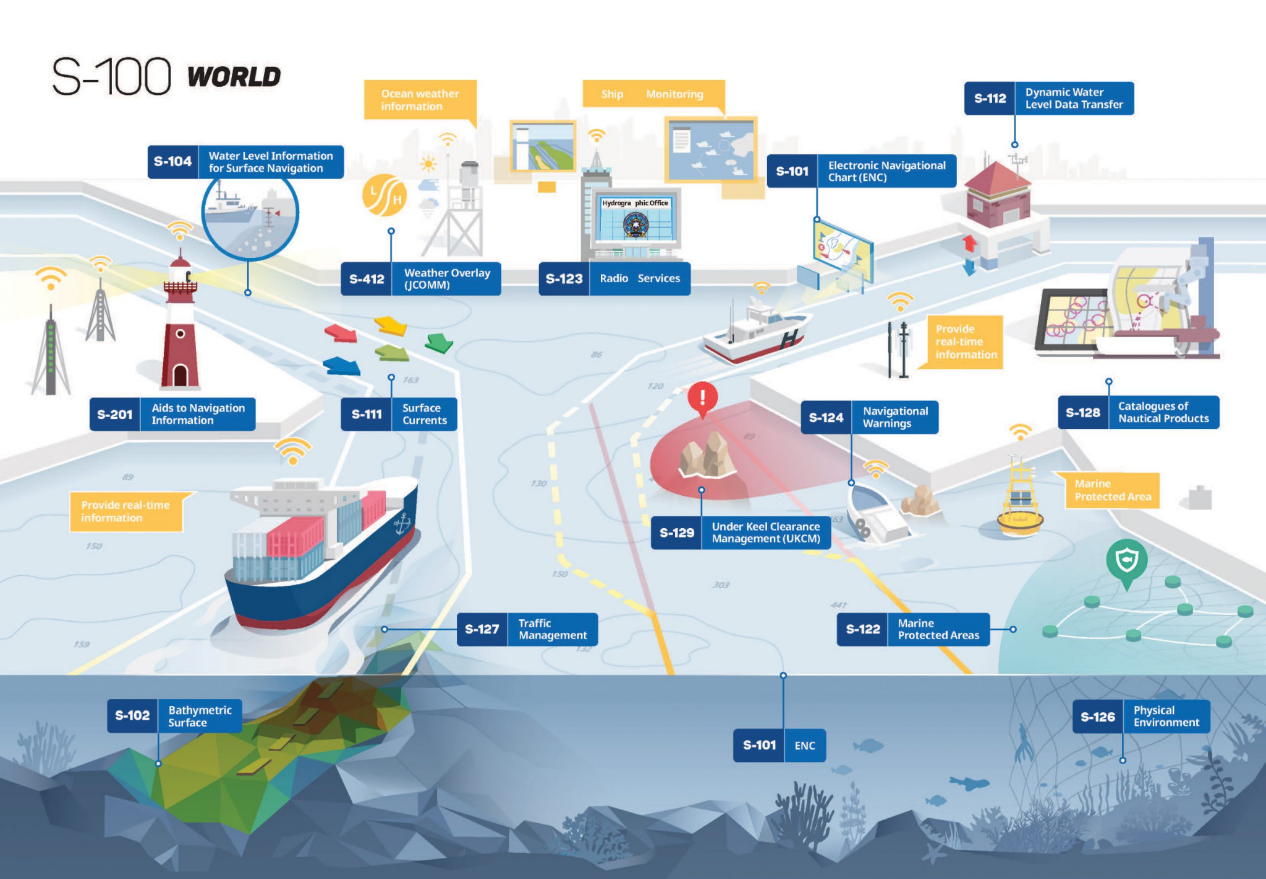
Figure 13: Illustration of the S-100 standard from IHO workflow representation. Within the S-100 framework, data from different disciplines can be used together in the same system.
© Korea Hydrographic and Oceanographic Agency (KHOA) (*)
This comprehensive and holistic approach integrates different standards such as S-127 Traffic management, and underscores the commitment to advancing uniformity, interoperability, and the seamless exchange of spatial information. It is applicable across all levels of implementation through Electronic Nautical Charts (ENCs) in Electronic Chart Display and Information Systems (ECDIS).
The key feature of S-100 is its flexibility, accommodating four dimensions (x, y, z and time) while currently lacking machine-readable files. Future generations of ENCs and other digital products and services will leverage this flexibility, enhancing navigation safety hydrographic, maritime and GIS communities (Delaroche et al., 2024).
Recently introduced, the IHO S-12219 Product Specification is designed specifically for MPAs and contains geospatial information related to their regulations. The symbols developed within this framework are crafted to effectively communicate the characteristics of MPAs and the associated regulations on ENCs. The primary objective of this system is to enhance navigational safety and promote compliance with MPA regulations by providing mariners with clear and standardised information (Figure 14).
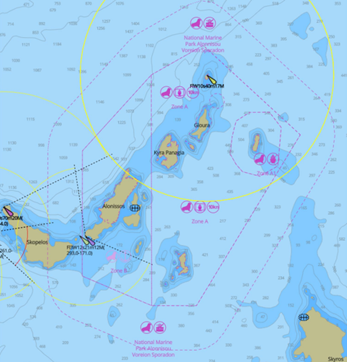
Figure 14: The S101 symbols, derived from the S101 portrayal, represented on an Electronical Nautical Chart (ENC).
© Delaroche et al., 2024 (*)
The ability of Web Map Services (WMS) and Web Feature Services (WFS) to apply common symbology across multiple datasets on the same topic further enhances both user flexibility and data coherence. Briefly, WMS provides a standard protocol for serving georeferenced map images over the Internet, allowing users to view and overlay various spatial datasets in a consistent visual format. WFS allows for the retrieval of feature data, enabling users to access, query, and manipulate geographic features directly. Utilising common symbology across these services makes sure that visual representations are uniform, facilitating easier comparison and interpretation of data from different sources.
The importance of symbology harmonisation within maritime data has been aptly demonstrated in projects such as eMSP-NBSR20 (Lequesne et al., 2023) and ReMAP projects (Delaroche et al., 2024). These projects underscore the challenges posed by inconsistencies in harmonisation methods for output data and emphasise the critical need for consistent symbology in transboundary MSP contexts.
Data coverage
Data coverage helps accurately represent marine ecosystems and human activities in space and time. Incomplete data can lead to ineffective management and overlooked critical elements. For instance, gaps in species distribution data can misplace conservation areas, failing to protect important habitats and species. Comprehensive data also helps identify conflicts and synergies between different marine activities, such as fishing, shipping, and wind farms, promoting sustainable development and ecosystem preservation. Diverse data collection methods such as satellite observations, underwater surveys, and community monitoring should be combined to support better understanding of the marine environment.
Spatial data coverage
In an era of ubiquitous data collection and generation, a key challenge for SDI is to make dataset layers as widely accessible as possible while maximising power, flexibility and ease of access (Baumann, 2021). According to the “Big Data” principles, data coverage is inherently multi-dimensional:
One dimension (or 1-D): sensor timeseries
Two dimensions (or 2-D): x/y images
Three dimensions (or 3-D): x/y/t image timeseries and x/y/z subsurface information
Four dimensions (or 4-D) x/y/z/t: complex information (e.g. atmospheric and oceanographic information)
The dimension axes defining the coverage's extent can be spatial, temporal, or abstract (with abstract referring to dimensions that are neither spatial nor temporal), or any combination of these. For example, maritime traffic data provided by the AIS satellite system spans two spatial axes and one temporal axis, forming a 3-D x/y/t image time series (Figure 15). In contrast, a geo-statistical data cube may include temporal and spatial axes along with thematic axes such as vessel attributes, resulting in a 4-D x/y/z/t structure (Figure 16).
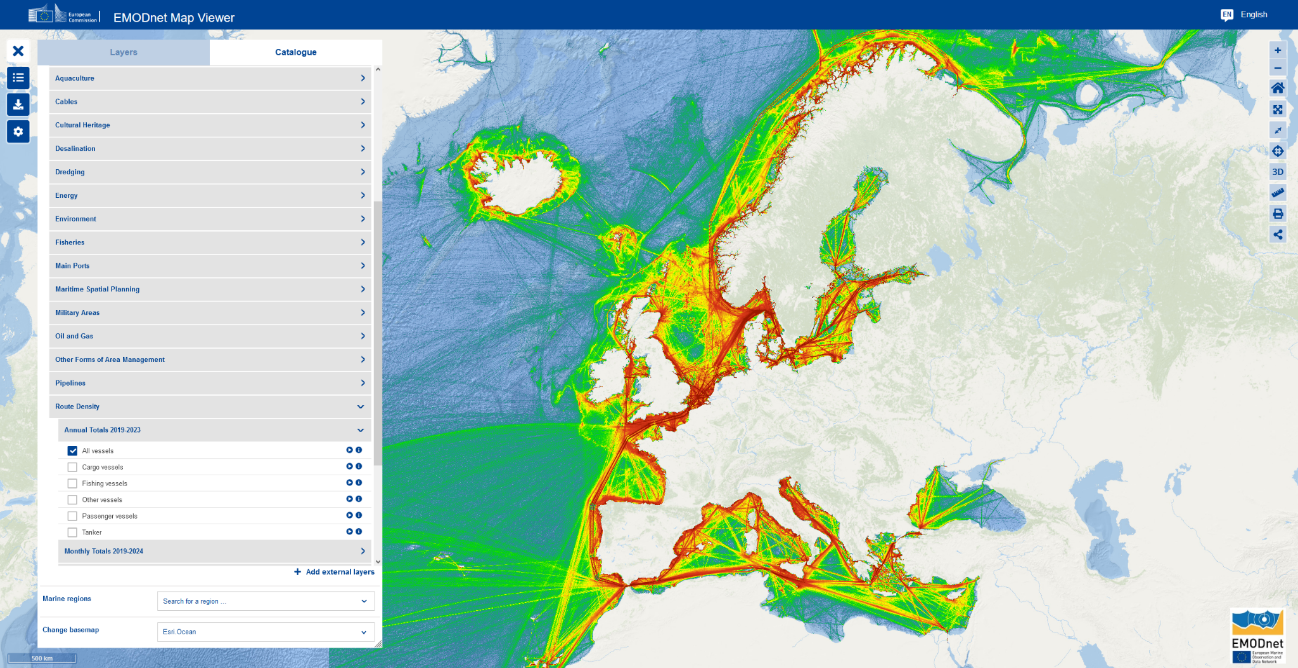
Figure 15: An EMSA Route Density Map from the EMODnet Human Activities, produced with https://emodnet.ec.europa.eu/geoviewer/
©EMODnet, 2019 (*)
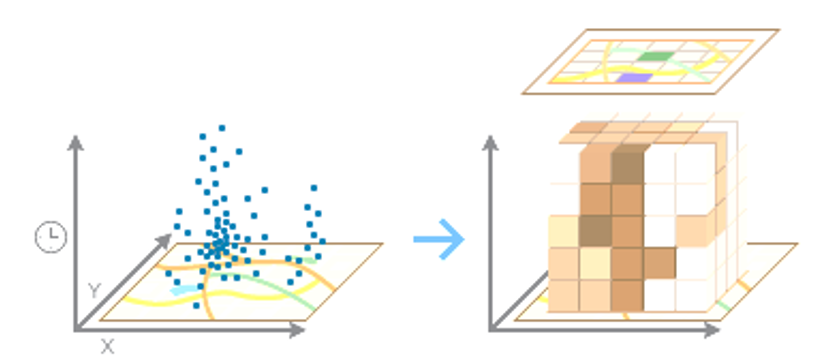
Figure 16: Transformation of data 3-D coverage to 4-D coverage21, created with ArcMap 10.8.
© Y. Leroy (*)
For the spatial dimension of data coverage, the minimum standard is to include both the Territorial Sea (up to 12 nautical miles) and the Exclusive Economic Zone (EEZ) (up to 200 nautical miles) in 2D. Generally, dataset layers are more complete within territorial waters, with coverage often diminishing for the EEZ beyond 25 nautical miles. In some cases, countries have no spatial data for the EEZ, while others provide only partial data. Additionally, some countries, such as some in the Mediterranean Sea basin, may not have formally declared an EEZ yet, leading to gaps in data coverage.
Within this minimum standard for spatial data coverage, finer spatial granularity in mapping both positions of human activities (e.g. fishing grounds) and natural phenomena (e.g. deep-sea ecosystems) enhances spatial coverage. For certain data, such as administrative boundaries, metric scale accuracy is the minimum requirement. More broadly, MSP initiatives using zoning tools rely on the ability to calculate surface area to support decision-making such as the percentage of MPAs versus the percentage of zones allocated for other uses such as resource extraction, fisheries or tourism (Habtemariam and Fang, 2016). Achieving this requires spatial data coverage approaching metric scale precision (Zuercher et al., 2022; Basirati et al., 2021). Consequently, integrating and promoting regional data, when feasible and relevant, becomes an essential standard. Such regional scale of spatial data could bridge coverage gaps if coordinated by the national authority responsible for MSP.
Dataset integration with neighbouring countries is essential and requires careful coordination. Key steps to facilitate transboundary data integration may include encoding data in standardized common coordinate reference systems and actively engaging with neighbouring geospatial authorities to establish seamless data coverage across borders.
Temporal data coverage
As previously discussed, incorporating the temporal dimension is reshaping spatial data coverage, particularly for spatio-temporal gridded data, commonly referred to as data cubes (Baumann, 2021). Often considered as the less significant dimensions in the context of spatial data, temporal coverage should cover past, present and future aspects of both human and non-human phenomena at sea. This minimum standard aligns with the Step-by-Step Guide developed by UNESCO-IOC (2009), referred to as the phase Assessments for planning in the MSPglobal Guide (UNESCO-IOC and European Commission, 2021).
For identifying existing conditions, temporal data coverage should cover a current present period, for instance of 2-3 years. This timeframe accommodates delays in the availability and updating of key data, such as the dynamics of offshore wind farm site designation (planned - approved - under construction - operational). Additionally, this present period should include a historical dimension to understand the origins of specific phenomena and/or inform geographic datasets (e.g. fishing grounds of small-scale fisheries communities). This can be achieved, for instance, through the deep mapping approach22.
For projecting future conditions, outlining the broad scenarios requires the utilisation of modelling tools. The temporal dimension of spatial coverage can vary significantly based on the data type, ranging from n+1 years to up to a century for climatic data. However, projecting a 10 - 15 year outlook presents challenges due to various structural and cyclical factors that impact the spatial and temporal coverage of the data.
In summary, in the light of the minimum standards required for both the temporal and spatial dimensions of data coverage, it is essential for SDIs to move beyond static cartographic representation. Instead, they should integrate temporal dynamics and establish a dedicated environment for data visualisation.

©Metamoreworks/Shutterstock.com (*)
3.1.2 Metadata
Metadata is data about other data. It describes the characteristics, attributes, and context of data, including details such as the data's source, licensing, restrictions, format, creation date, author, structure, and how it should be used or interpreted.
Metadata is an integral part of any properly functioning data infrastructure, spatial or otherwise, as it gives the context to allow proper understanding of the data in the system. Several generic metadata standards exist as well as good practices on how to create proper thematic metadata description (e.g. Leadbetter et al., 2023). Metadata management is particularly important for a functional SDI, as relying solely on a generic metadata model does not necessarily provide the comprehensive metadata descriptions needed to understand a dataset's limitations or its background and lineage.
In general, metadata can be categorised into 3 main classes, depending on what aspects of the data it describes:
Descriptive metadata: “How to discover, identify and access the dataset?”
Title, Description, Keywords, Themes, Geographical and temporal coverage.Administrative metadata: “What technical information is linked to the dataset?” Usage rights, Intellectual property, Ownership, Creation date, Size of the dataset.
Structural metadata: “How is the dataset organised?” - Variables.
Metadata development for MSP is essential for managing and using marine data effectively. Comprehensive metadata supports various aspects such as standardisation, interoperability, discoverability, readability, searchability, a hierarchical approach, metadata release cycle, and information about data sensitivity and licensing. Metadata profiles such as the “Metadata Data Standard for Marine Spatial Plans” developed by the European Commission’s Technical Expert Group on Data for MSP (Leadbetter et al., 2023) address these issues.
- Standardisation
Standardisation of metadata supports uniformity across marine datasets, enabling consistent descriptions and facilitating data integration. For MSP, adopting standardised metadata schemas and vocabularies (e.g., ISO 1911523 for geographic information) makes sure that data from various sources can be seamlessly combined and compared. Standardised metadata practices are critical for accurate analysis, planning, and decision-making in marine environments.
- Interoperability
Creating interoperable metadata involves using common standards and protocols that enable data sharing and integration across different systems. This is crucial for MSP, where data from various sources (e.g., governmental agencies, research institutions, and private entities) must be combined to create comprehensive marine spatial plans. Metadata should be published using broadly adopted and technically sound profiles which can easily be translated into other metadata profiles (e.g. using translations between ISO 19115, Schema.org24 as used by the Ocean Data & Information System of UNESCO and DCAT25 as used by European data portal initiatives).
Interoperability is also enhanced by using:
published, controlled vocabularies to populate metadata fields, such as the Hierarchical INSPIRE Land Use Classification System or the EMODnet Human Activity types in case of the EU.
Hypertext Transfer Protocol (HTTP) Uniform Resource Identifiers (URIs) to identify the vocabulary terms within the metadata (Wilkinson et al., 2016; Leadbetter, 2015).
U.S. Geological Survey (USGS) supported Federal Geographic Data Committee (FGDC) metadata standards such as the Content Standard for Digital Geospatial Metadata (CSDGM) and the adoption of ISO 19115, which support the consistent documentation of geospatial datasets. USGS also supports the Earth Resources Observation and Science (EROS) Standards for remote sensing data, particularly for organizing and disseminating satellite imagery (e.g., Landsat data), enabling uniform access and analysis, as well as the Geologic Map Schema (GeMS) which is a standardized schema for digital geologic map databases, ensuring uniformity in representing geological features across states and regions.
USGS also contributes to Darwin Core and Biodiversity Information Standards (TDWG) to support the sharing of species occurrence and ecological data.
Coastal and Marine Ecological Classification Standard (CMECS) as a classification standard developed to organise ecological and habitat data consistently. It integrates physical, biological, and chemical attributes of marine environments to enable interoperability across different datasets. CMECS also aligns with standards like the Marine Metadata Interoperability (MMI) project, facilitating semantic interoperability for marine spatial planning.
Comprehensive marine specific vocabularies relevant to many source datasets used in MSP can be accessed via vocab-servers such as the Marine Metadata Interoperability project (MMI, n.d)26 and SeaDataNet (SDN, n.d.)27.
- Discoverability
Discoverability refers to the ease with which data can be located and accessed. For MSP, metadata should be designed to enhance the discoverability of marine datasets by including detailed descriptions, keywords, and categorisations. This helps users quickly find relevant data for analysis and planning purposes. Using metadata standards that support search engine optimisation can further improve the visibility of marine data. Using metadata profiles in standardised, interoperable formats (e.g. JSON, JSON-LD, XML) and using broadly understood semantic markup (e.g. Schema.org) allows better harvesting of the metadata by search engines as well as more rapid reuse by other systems.
- Readability
Readability refers to how easily metadata can be understood by different users, including those without technical expertise. Metadata should be written in clear, concise language and avoid technical jargon. This makes sure that a wider audience, including policymakers, stakeholders, and the public, can comprehend and use the data effectively.
- Searchability
Searchability involves the ability to efficiently search for specific data within a larger dataset. Metadata should include detailed and structured information that allows users to perform advanced searches. Implementing search functionalities that leverage metadata, such as filtering and faceted search, can greatly enhance the ability to find specific marine data. Specialised tools are required to efficiently search multiple machine-readable metadata records.
- Hierarchical approach
A hierarchical approach to metadata involves organising metadata in a structured manner that reflects the relationships between different data elements. In MSP, this means creating metadata hierarchies that correspond to different levels of spatial planning (e.g., local, national, regional) and types of data (e.g., physical, biological, socio-economic). This structured approach helps users navigate complex datasets and understand the context and relevance of different data layers.
- Metadata Release Cycle
The metadata release cycle refers to the regular updating and publishing of metadata to affirm it remains current and accurate. This includes defining the frequency of updates, the process for reviewing and validating metadata, and the mechanisms for disseminating updated metadata to users. Regular updates support marine spatial plans to be based on the most recent and accurate data. The release dates and version history of the metadata should be clearly stated within the published metadata.
- Information about data sensitivity and licencing
Metadata should include detailed information about data sensitivity and licensing to guide users on the appropriate use of data. For MSP, it involves specifying data sensitivity levels (e.g., public, restricted, confidential) and providing clear licensing terms (e.g., Creative Commons, 2022, proprietary) that outline how the data can be used, shared, and redistributed. Including this information in metadata helps provide for compliance with legal and ethical standards and promotes responsible data usage. Please see Chapter 5 for more details about data sensitivity and security.
Metadata plays a key role in data management and needs to be implemented and checked thoroughly when dealing with datasets and entire data architectures. Please see Chapters 3.1.2 and 3.2 for metadata suggestions in the data architecture context.
Box 11: The MSPex, an automated metadata catalog indexer for Marine Spatial Planning
MSPex is an automatic metadata catalogue indexer specifically designed for MSP. Developed as part of the Reviewing and Evaluating the Monitoring and Assessment of MSP (ReMAP) project28 by the French Naval Hydrographic and Oceanographic Service (SHOM) MSP Unit, MSPex streamlines the process of organising and managing metadata associated with marine datasets. By automatically indexing and categorising this information, MSPex facilitates easier access and retrieval, ultimately enhancing data quality and control (Fouque et al., 2024).
3.2 Data architecture
The data architecture for a spatial data infrastructure (SDI) is the technical infrastructure that organises, standardises and integrates diverse datasets. The architecture encompasses the design and implementation of data models, databases and metadata standards (Box 12), and involves the use of standardised formats and protocols. Technologies such as Geographic Information Systems (GIS), cloud computing, and various data analysis tools are used to store, process, and visualise selected datasets from the database. Additionally, the architecture supports the creation of data portals and services that provide users with easy access to marine spatial data.
Box 12: Importance of metadata for the data architecture of the Spatial Data Infrastructure
Metadata is crucial for data architecture because it provides the essential context and structure needed to organise, manage, and retrieve the data.
From a data architecture perspective, it should be clearly defined at which level metadata records are created within the SDI. Are they generated at the database level, at the dataset level (with a dataset being a specific extract from a database), or through a combination of both? In some cases, metadata records may be necessary at the dataset level, as in specific data products used in the MSP process, e.g. a map of the modelled reproduction area of key fish species.
Metadata management is typically carried out separately from the data itself using dedicated platforms such as Geonetwork29 or CKAN30. This separation poses a data management challenge, as datasets and their corresponding metadata records need to be updated simultaneously. While internal automated processes can be implemented to address these issues, they add complexity to the overall system architecture and increase the likelihood of errors.
Overall, it is recommended to use widely adopted metadata schemes and create thorough metadata documentation for each dataset available through the SDI.
3.2.1 Data structure and format
Data within a spatial database is organised through a structured schema, data models, and specific data formats to efficiently manage and query geographic information (Figure 17). The below sections outline more details about each of these concepts.

Figure 17: Simplified illustration of spatial database organisation by schema, model and format. Please note that for visualisation purposes, only selected parts of the database structure are shown.
© UNESCO
Spatial Database Schema
A database schema defines how spatial data is organised and stored within a database. It includes tables, fields, relationships, constraints and spatial indices for efficient data management and query. It outlines how data is logically grouped and interrelated, specifying the types of data each table holds, the format of the data fields, and how tables interact with each other through relationships. The schema provides the framework for data storage, retrieval and manipulation within the database system.
Well-designed schemas support efficient querying and data retrieval. Depending on the relationships between data, different database schema types such as flat, hierarchical, network, relational, star or snowflake model may be selected, usually by the database administrator or programmer.
Geospatial Data Models
Geospatial data models define how the actual spatial information is represented and organised. Spatial data is typically organised in vector (points, lines, polygons) or raster (grid-based) formats. Vector models are used for discrete features like boundaries and shipping routes, while raster models represent continuous data like ocean temperature (Figure 18).
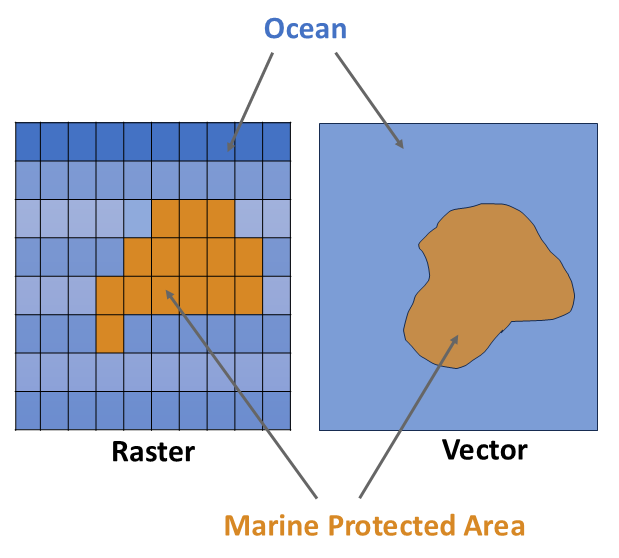
Figure 18: Representation of spatial features in raster (left) and vector (right) data format. In this example, blue areas show the ocean, red a Marine Protected Area.
© UNESCO
Spatial Data Formats
Data formats specify the standardised encoding scheme for geospatial information. This is the foundation for data to be readable and interpretable correctly across different systems and applications. Spatial data formats serve different purposes and are chosen based on the specific needs of data handling, sharing, and application requirements. Commonly used formats are summarised in Table 5.
Table 5: Commonly used spatial data formats with key characteristics and areas of use for each format.
| Data format | Description | Used for |
| Shapefile (.shp) | A popular vector format developed by Esri for storing spatial data, including geometry and attribute information. It consists of multiple files (.shp for geometry, .shx for index, .dbf for attributes) that work together to represent spatial data in vector format. | Widely used in GIS applications for data analysis and visualisation. Suited for discrete features like points, lines, and polygons. |
| GeoJSON (.geojson) | A format for encoding a variety of geographic data structures using JavaScript Object Notation (JSON), | Commonly used for web applications due to its lightweight and human-readable format. |
| KML (Keyhole Markup Language) (.kml) | An XML format used for representing geographic data in applications like Google Earth. Supports geographic features and annotations, including placemarks, polygons, and images. | Useful for visualising geographic data in 3D environments and on web maps. |
| GML (Geography Markup Language) (.gml) | An XML-based format for encoding geographic information, enabling interoperability across different systems. | Data format supporting complex spatial data representations. |
| GeoTIFF (Tagged Image File Format with georeferencing information) (.tif) | A type of raster data format that combines image data with geospatial metadata. It stores pixel-based information such as satellite imagery and includes embedded georeferencing information about the map projection and coordinate system. | Ideal for applications requiring detailed and continuous surface analysis as GeoTIFF supports rich, pixel-based information. |
3.2.2 Database Management System
The Database Management System (DBMS) is the software that facilitates the creation, management and controlled access to databases. It serves as the backbone for efficient data handling through providing a systematic way to store, retrieve, update and manage large volumes of data efficiently and securely. A DBMS assures that data remains consistent, accurate and accessible to authorised users.
In the context of an SDI, the DBMS must handle complex spatial data types, support advanced spatial queries, and enhance interoperability with various GIS tools and standards (Box 13).
The DBMS serves as an intermediary between users and the physical database by providing access to tools and interfaces to perform database operations such as querying, updating and maintaining data. It facilitates communication between the database, users, applications, and other DBMSs primarily through the use of Structured Query Language (SQL).
SQL acts as a standard language for querying and manipulating data. By providing a uniform interface, SQL enables database administrators, developers and analysts to retrieve, insert, update, and delete data without needing detailed knowledge of the underlying database structure. In that way, SQL differs from other languages as it describes what the user wants the computer to do rather than how it should do it. Additionally, SQL facilitates interoperability between different DBMSs for data exchange and integration across various systems (Figure 19).
The choice of DBMS significantly impacts the performance, scalability, and reliability of the SDI, influencing how geospatial data can be managed and used. A robust DBMS underpins the entire infrastructure, enabling comprehensive data analysis, visualisation, and decision-making processes.
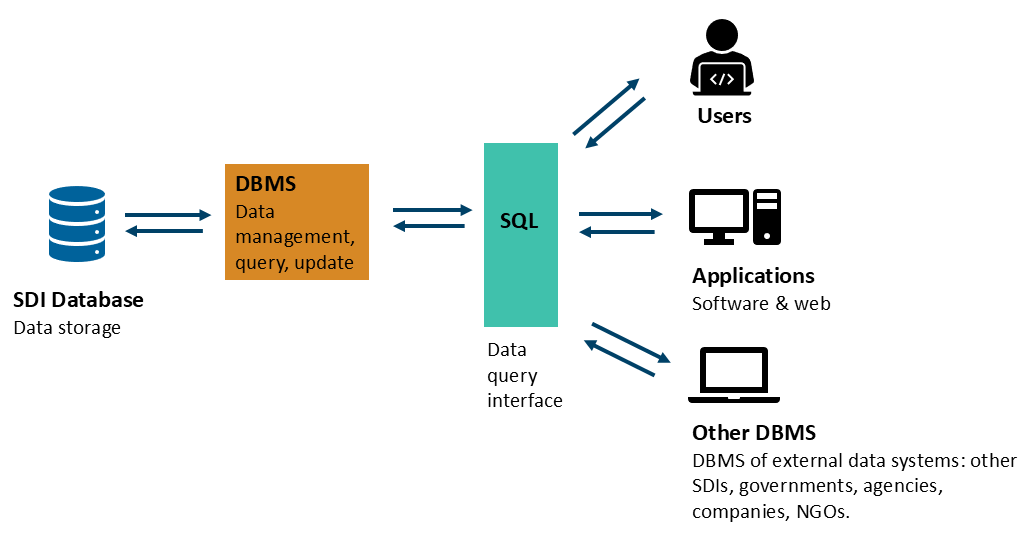
Figure 19: Schema of the DBMS as an intermediary between the database and the user, facilitated by SQL as the query interface.
© UNESCO
Box 13: General considerations when choosing the Database Management System for the Spatial Data Infrastructure
When choosing a DBMS, the following considerations should be applied:
Scalability and Performance: Choose a DBMS that can scale horizontally and vertically to handle increasing data volumes and user demands. Consider distributed databases or cloud-based solutions to enhance performance and scalability.
Interoperability: Assures the DBMS supports standard spatial data formats and interoperability with other GIS tools and
systems. This includes support for OGC standards and integration capabilities with external data sources. See Chapter 3.2.4 on Interoperability.Data Security and Integrity: Implement robust security measures, including encryption, access controls, and backup solutions. Please see Chapter 5 on Data Security.
Ease of Use and Management: Choose a DBMS that offers intuitive management interfaces, comprehensive documentation, and strong community or vendor support. This reduces the complexity of database administration and enhances user acceptance.
Cost Considerations: Evaluate the total cost of ownership, including licensing fees, maintenance costs, and potential hardware or cloud service expenses. Open-source solutions like PostGIS31 can offer cost-effective alternatives to proprietary systems.
There are various DBMS software applications available (Table 6), each suited to different data volumes, SDI project goals, budgets and support needs. Please be aware that the table only lists a selection and that there are additional tools and platforms that may also meet specific requirements.
Table 6: Database Management System software suitable for SDI management. (Note: Please be aware that the table only lists a selection of available tools)
| DBMS | Key features | Suitable for | O pen- sou rce? |
| PostgreSQL with PostGIS | PostgreSQL is an open-source relational database, with PostGIS as an extension that adds support for geographic objects. It is highly scalable, supports advanced spatial queries, and has robust community support. It is well-suited for handling complex spatial data types and operations. | Open-source, cost – efficient solutions. It supports integration with various open-source GIS tools like QGIS. | Yes. |
| MySQL with Spatial Extensions | Open-source relational database that includes spatial extensions to support geographic data types and spatial functions. While not as feature-rich as PostGIS, MySQL’s spatial extensions provide basic capabilities for managing and querying spatial data. |
Open-source, cost – efficient projects that need less sophisticated data management and analysis tools than what PostGIS offers. | Yes. |
| GeoServer (often used with PostGIS) | Open-source server that allows users to share and edit geospatial data. Can be used with various databases but works particularly well with PostGIS. Supports OGC standards such as WMS, WFS, and WCS. |
Organisations needing to publish marine spatial data on the web and provide interoperable web services for data sharing and visualisation | Yes. |
| Microsoft SQL Server with Spatial Extensions | Supports spatial data types and operations natively. Provides integration with other Microsoft products, and a user-friendly management interface. The spatial features in SQL Server are well-documented and supported. |
Organisations using a Mi crosoft-centric IT environment, providing easy integration with applications like ArcGIS and other enterprise systems. | No. |
| Oracle Spatial and Graph | Powerful, enterprise-level database that supports advanced spatial analytics and graph data models. Provides high performance, reliability, and scalability. Oracle's extensive support for spatial data types and functions makes it suitable for complex marine spatial data requirements. |
Organisations with existing Oracle infrastructure or those requiring h igh-performance spatial analytics and robust data management for applications. | No. |
| Esri ArcGIS Enterprise (with ArcSDE) | Provides a comprehensive suite of tools for managing and analysing spatial data. ArcSDE (Spatial Database Engine) extends the capabilities of standard relational databases to support spatial data. |
Organisations that require a full suite of GIS tools for advanced spatial analysis, mapping, and visualisation. It is compatible with Esri's ArcGIS platform. | No. |
3.2.3 Data storage
There are different options of where and how to store the SDI data content. The main choice is between on-premise and cloud – based storage options (Box 14), each of which has its advantages and trade-offs (Table 7). Generally, on-premise solutions offer control and portability, while cloud-based solutions provide easier scalability, global accessibility and integration with advanced tools and services as well as integrated emergency data recovery options.
The choice between on-premise and cloud storage depends on factors such as data volume, accessibility requirements, budget, infrastructure needs, and security and privacy concerns. Please also see Chapter 5.1 for details about data privacy and geospatial data sovereignty in the context of cloud data storage.
Table 7: Comparison of on-premise and cloud-based SDI storage solutions.
| On premise storage | Cloud storage | |
| Control | Provides direct control over hardware, security, and data management, allowing for customised configurations and security measures. | Less direct control over data and security management, as the security of the underlying infrastructure is managed by the cloud provider. At the same time, this provides a comprehensive and up-to-date security layer for all customers using the cloud storage. |
| Acces sibility | Data access is restricted to the local network or physical location, limiting remote work capabilities and collaboration. Data is only available internally without running an additional data publishing web interface. | Data can be accessed from anywhere with an internet connection, enabling remote work and collaboration across locations. However, it requires a stable internet connection for access, which can be a limitation in areas with poor connectivity. See the term latency below for access speed scaling by cloud providers. |
| Latency | Data access may be faster with local storage due to the absence of network latency, which is beneficial in case of slow internet connections. However, on-premise data access is dependent on a number of local limitations, e.g., the speed of the local network and the capability of the local data servers. |
Data access may experience latency due to internet connectivity, which can affect performance for certain applications. Cloud storage is generally designed to scale speed of access on demand: if there is low-capacity Internet connection, the data being delivered will be slow. However, with cloud providers, customers can usually log into a virtual machine hosted in the same facility as the data, thus increasing the access speed to the data. |
| Sca lability | Expanding storage capacity requires purchasing and installing additional hardware, which can be costly and complex. | Cloud providers can up-or downscale storage capacity according to needs, accommodating varying amounts of data without upfront investment in hardware. |
| Mai ntenance | Requires ongoing maintenance, upgrades, and backups, which can be resource-intensive and require specialised knowledge. | The cloud provider handles hardware maintenance, software updates, and system management, reducing the administrative burden on users. |
| Backup and disaster risk | Local storage is vulnerable to physical risks like hardware failure, theft, or natural disasters unless proper backup and disaster recovery measures are in place. | Usually includes built-in redundancy and backup solutions, enhancing data durability and recovery options in case of failures. A cloud storage solution can be part of good practice for data backups. |
| Security & co mpliance | Security: All security aspects have to be provided by the customer, from locks on the doors to the building, the logins to resources made available online. This can be complex and costly to set up and manage. Compliance: Data is stored on-site, which can simplify compliance with data sovereignty laws and regulations. |
Security: The cloud provider offers the security of the underlying infrastructure that all clients benefit from. Security measures are updated to the most recent requirements by the provider. Compliance: Storing data off-site may raise security and privacy issues, especially for sensitive or regulated information. However, the advantages of security offered by the cloud provider is usually very sophisticated and outweighs the risks. |
| Cost | Often involves a one-time capital expenditure for hardware, potentially reducing long-term costs compared to ongoing cloud subscription fees. However, users have to plan and purchase capacity ahead of time. There is a risk of paying for storage infrastructure while still empty. |
Initial costs are low as no expenditure for hardware purchase and setup. Long-term storage costs can accumulate, especially with large volumes of data. However, cloud storage often operates on a pay-as-you-go model, allowing for budget flexibility. |
| Vendor lock risk | Tools: On premises storage often involves less standardised components and formats than those used by cloud providers, as these update to most recent technologies. Keeping on-premise systems updated to a similar level involves costs and time investment. Data storage: generally not dependent on a service provider's infrastructure or proprietary tools. |
Tools: Cloud providers mostly employ widely used technologies due to the widespread use of their services. Often includes open-source solutions. Data storage: Reliance on a specific cloud provider may lead to extra fees if migrating to another provider or back to on-premises systems. |
Box 14: Examples of different options of cloud storage solutions for the Spatial Data Infrastructure
Cloud storage includes the following options:
Cloud-based object storage: Manages data as discrete units, providing flexible and accessible storage for a variety of data types over the internet. Providers are Amazon Web Services, Google Cloud Platform or Microsoft Azure.
Cloud-based relational databases: Managed database services hosted in the cloud that include sophisticated SQL querying to handle, store and manage data in tables with relationships. Examples are Amazon RDS for PostgreSQL with PostGIS and Google Cloud SQL for PostgreSQL.
Cloud-based NoSQL Databases: Managed database services that provide flexible schema design and can handle unstructured or semi-structured data. Examples include Amazon DynamoDB and Google Cloud Firestore.
Cloud Data Warehousing Solutions: Services designed for analytics that allow for the storage of large amounts of structured and semi-structured data. Examples include Amazon Redshift and Google BigQuery.
Data Lake Solutions: Cloud-based repositories that store structured and unstructured data at scale, allowing for big data analytics and processing. Examples include AWS Lake Formation and Azure Data Lake Storage.
Cloud-based Spatial Data Management Systems: Platforms specifically designed for storing and managing spatial data with itegrated GIS capabilities. Examples include GeoServer in a cloud deployment and Carto.
Cloud-based GIS platforms: Online services that provide combined tools for storing, analysing and visualising geographic and spatial data through web-accessible interfaces. This option offers maximal integration and flexibility of services, but also results in high dependency on particular vendors as all data and tools are centralised on one platform. Examples are Esri ArcGIS Online and Mapbox.
Cloud-based Research Data Repositories: Specialised platforms for storing and sharing research data, often with a focus on FAIR data principles. Examples include Dryad and Zenodo.
Multi-cloud Storage Solutions: Platforms that allow data to be distributed across multiple cloud providers to avoid vendor lock-in and improve redundancy. Examples include NetApp Multi-Cloud Data Services.
Object Storage Gateways: Solutions that allow organisations to connect existing applications to cloud object storage, bridging on-premises data with cloud storage. Examples include NetApp StorageGRID and AWS Storage Gateway.
Hybrid storage solutions: Organisations often use cloud storage for backup and disaster recovery while maintaining primary data on local servers. This hybrid approach integrates advantages from both storage options.
3.2.4 SDI connectivity and interoperability
SDI connectivity refers to the seamless integration and communication between various data systems and repositories. This connectivity is key for enabling efficient data sharing among diverse platforms and stakeholders, ensuring that comprehensive and up-to-date data is readily accessible. By establishing standardised protocols and interfaces, SDI connectivity allows different systems to interact smoothly, breaking down unnecessary separations and fostering collaboration across organisations and sectors.
The benefits of SDI connectivity extend beyond data sharing. It facilitates real-time data exchange, providing stakeholders with timely and relevant information for decision-making processes. Additionally, it significantly reduces data duplication, as a single, authoritative source of data can be accessed by multiple users. This not only improves data accuracy and reliability but also results in cost savings, as partners can share the expenses related to data storage, processing, and dissemination.
Integrating data across different domains - such as navigation, fisheries, research, environmental monitoring, IPLCs territories, and real-time satellite or oceanographic sensor data - enhances operational efficiency by providing access to a broad spectrum of spatial data.
SDI connectivity must be considered across local, national, regional, and international levels in order to optimise data sharing and collaboration opportunities. In general, connecting SDIs at different levels facilitates addressing complex global challenges such as comprehensive ocean monitoring, maritime security, emergency responses and cross-border planning (Figure 20).

Figure 20: Graphical representation of SDI connectivity across disciplines at the local, national, regional and global level.
© UNESCO
The different levels of SDI connectivity can be described as follows:
- At the local level, SDI connectivity involves linking data systems within a specific geographic area, such as a coastal area, port, or local community. Examples for SDI connectivity at the local level include:
The integration of data from local environmental monitoring stations, coastal infrastructure, and community stakeholders into coastal zone management.
Sharing data on marine biodiversity, fishing activities, and water quality within a local MPA.
Connecting data from port authorities, shipping companies and environmental agencies to optimise port logistics and reduce environmental impact.
At the national level, SDI connectivity refers to connecting data systems and repositories across different regions, states, or provinces within a country. Examples for SDI connectivity at the national level may involve the creation of a national marine data portal as a centralised platform that integrates data from various national agencies such as fisheries, navigation, environmental monitoring and protection to support national MSP initiatives. Linking data on fishing activities, stock assessment and regulatory measures may support sustainable management of national fishery resources, for instance.
At the regional level, SDI connectivity involves linking data systems across multiple countries within a specific region, ocean or economic bloc. SDI connectivity at the regional level includes sharing marine geospatial data among neighbouring countries to support regional resource management, environmental monitoring, sustainable ocean planning, blue economy and disaster management across country borders. Examples for SDI connectivity at the regional level comprise:
Regional Fisheries Management Organisations (RFMOs) are working on regional levels, integrating fisheries data from multiple countries within a region to manage fish stocks effectively.
The European Marine Observation and Data Network (EMODnet)32 integrates marine data from EU member states to support marine research, policy making, and sustainable management of marine resources.
- At the global level, SDI connectivity involves linking data systems across countries and continents, facilitating global data exchange and collaboration. Examples for SDI connectivity at international levels include:
The Ocean Data Information System (ODIS)33, a federation of digital independent systems interoperating in a common digital ecosystem (Figure 21). The digital assets (datasets, documents, services, etc) that ODIS Partners wish to share are expressed over the Web using shared standards and conventions, coordinated by IODE. Users and developers then have access to harmonised interfaces, supporting many application-layer activities, including geospatial services34.
A further example of international connectivity is the Global Ocean Observing System (GOOS)35, with its mission to lead the ocean observing community and create partnerships to grow an integrated, responsive and sustained observing system that serves users as effectively as possible.
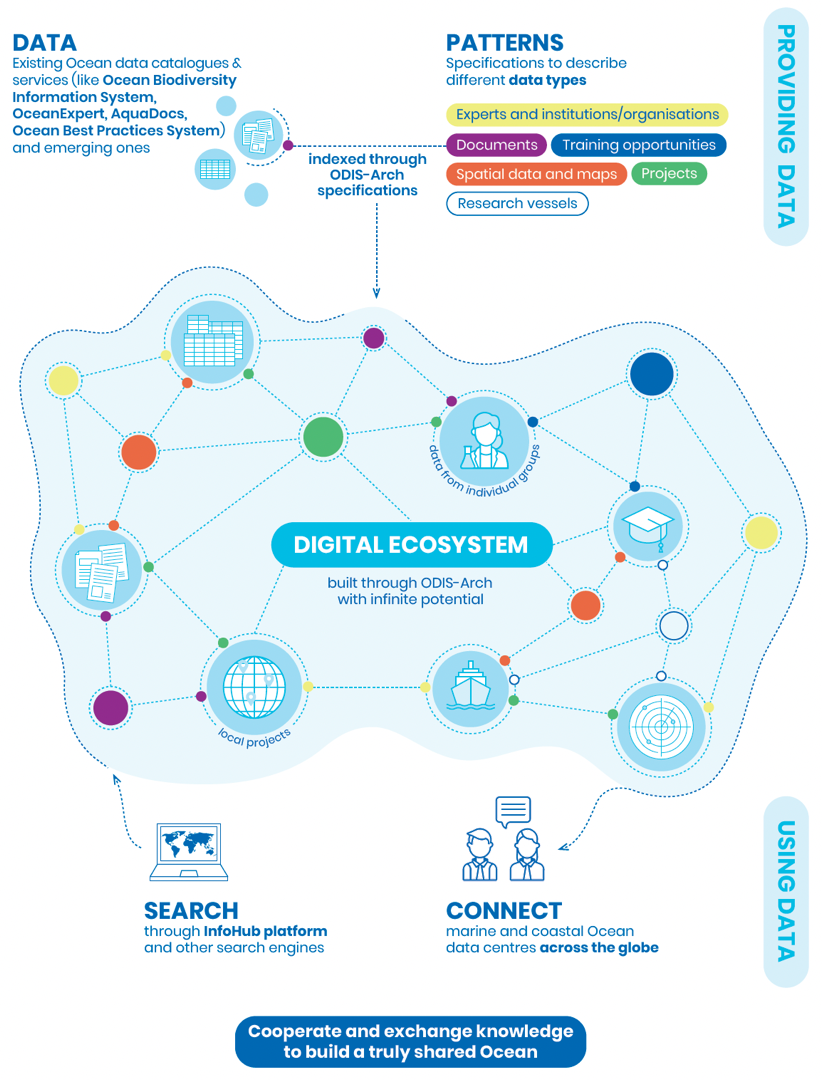
Figure 21: The ODIS Knowledge Graph: The digital asset catalogue(s) of each ODIS Partner - including their geospatial (meta)data - are harvested by IODE and assembled into a knowledge graph to enhance greater global interoperability, collaboration, and coordinated technology development. Discovering all ODIS Partner assets (datasets, documents, services, training opportunities, etc) relevant to a geospatial region is now possible using well-known linked open data approaches, supporting GeoSPARQL / WKT.
© UNESCO
By establishing clear and uniform standards, SDI connectivity can be significantly facilitated. Data and metadata standards enable seamless data integration and sharing across different organisations and platforms by providing a common framework for data description, storage, and retrieval. Metadata standards offer detailed information about the data's source, accuracy, and limitations, which is essential for assessing its suitability for specific applications across datasets and systems.
Finally, IOC’s Ocean Decade Data and Information Strategy36Implementation Plan includes practical guidelines on how to improve interoperability of ocean datasets, repositories and platforms, for example using (meta)data standards.
For more details on SDI interoperability and metadata please see Chapter 3.1, for additional information about identification of SDI connectivity please see Chapter 2 Task 8.
3.2.5 Data analysis, visualisation and access options
Data analysis, visualisation, and access are among the core purposes of an SDI in the MSP process, as they enable the retrieval, examination and interpretation of the complex and multi-disciplinary datasets stored within the SDI.
These tools rely on robust data architecture, comprehensive metadata, and adherence to standards to facilitate seamless integration with databases (see Chapter 3.3 for good practices for data). A well-structured data architecture facilitates efficient data storage, retrieval, and management, enabling visualisation and analysis tools to interact with the database smoothly. Comprehensive metadata provides context and details about the data, enhancing its usability and interpretability across different applications (see Chapter 3.1.2). Adhering to established standards supports consistency and interoperability, allowing diverse tools and systems to work together effectively (Figure 22).
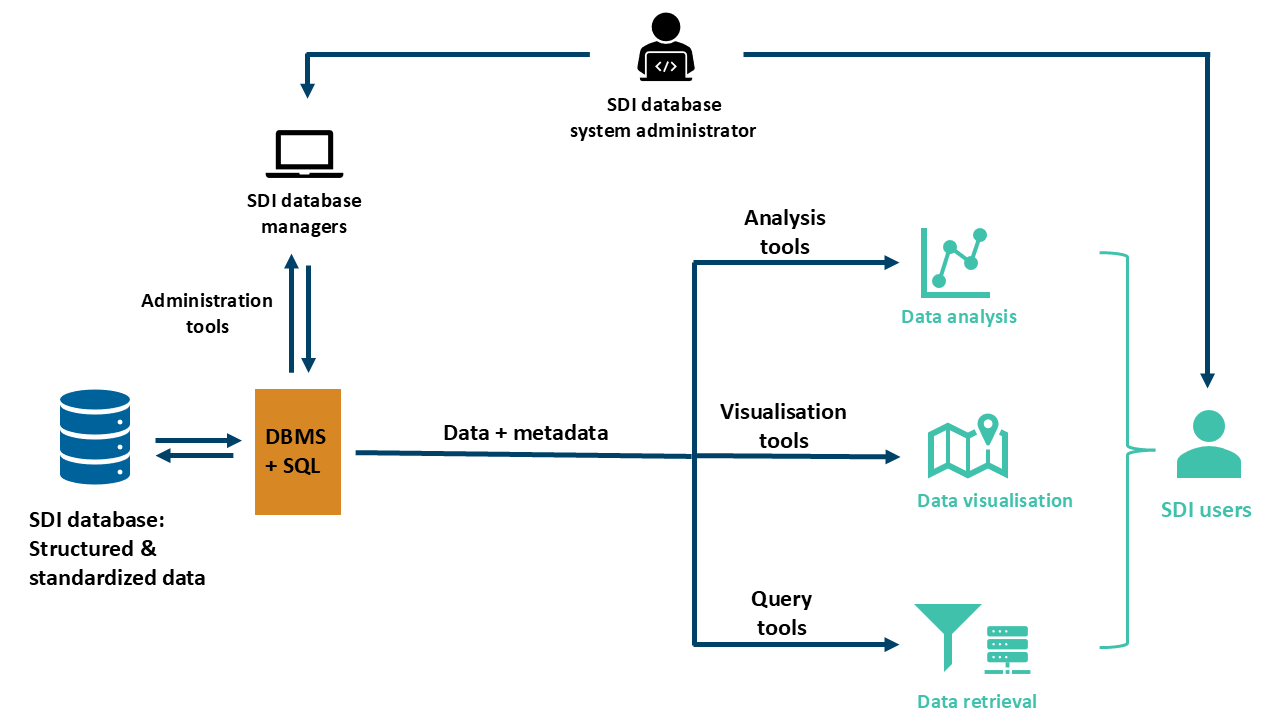
Figure 22: SDI users access to the SDI for analysis, visualisation and retrieval, also showing SDI management and administration.
© UNESCO
Data analysis
Data analysis refers to the processing and interpreting of datasets to identify and visualise patterns, trends and relationships that are often not immediately apparent, providing deeper insights into the spatio-temporal dynamics and underlying processes of the data.
GIS software such as ArcGIS37, QGIS38, and GRASS GIS39 provide robust and accessible tools for spatial analysis, allowing users to perform complex queries, overlay analyses, and geostatistical operations. Open-source GIS solutions like QGIS provide such powerful data analysis capabilities without the cost of proprietary software. A further advantage of open-source solutions lies in their flexibility and the active community support, which continually adds new features and plugins to the software. QGIS, in particular, supports integration with the programming languages Python40 and R41, enabling users to create custom extensions and automate complex spatial analyses.
Visualisation
Visualisation is a key component in communicating MSP-relevant data findings in an accessible way. Visualisation tools transform raw spatial data or complex analysis results into comprehensible and interactive maps and 3D models.
Tools such as Mapbox42, Google Earth Engine43, and Tableau44 provide a range of capabilities for such visualisation. Open-source tools offer sophisticated options in this area. QGIS is proficient in creating high-quality, interactive maps and 3D visualisations, and its compatibility with Python and R allows users to access libraries such as Matplotlib, Plotly, and ggplot2 for advanced data visualisation and the option of tailoring visual outputs to specific needs.
Access options
Streamlined access options to data stored within an SDI assure that data is readily available and usable by various GIS tools and MSP stakeholders.
Web-based GIS platforms, such as GeoServer and ArcGIS Online, offer comprehensive solutions for data storage, management, and dissemination. These platforms support various data formats and standards, ensuring interoperability and ease of access.
Access tools for spatial data are also supported by open-source solutions, which prioritise interoperability and ease of data sharing. QGIS supports a wide range of data formats and standards, ensuring that spatial data can be easily imported, exported, and shared across different platforms and stakeholders. Web-based extensions, such as QGIS Server and GeoServer, provide robust solutions for publishing and accessing spatial data online. Additionally, the integration of Python and R enables the development of custom scripts for data retrieval and processing from various sources, including databases and Applicable Programming Interfaces (APIs).
Box 15 describes Brazil’s National SDI supporting MSP including its components for data analysis, visualisation and access.
Please see Chapter 4 for more details on web architecture and accessibility.
Case Study
Box 15: Spatial Data Infrastructure to support participatory mapping in Brazilian MSP
Contributed by Tiago Borges Ribeiro Gandra
Brazil’s Marine Spatial Planning (MSP) encompasses its extensive maritime territory of 5.7 million km². The process is being managed by distinct teams across four regions: South, Southeast, Northeast, and North. The South MSP is meant to be the Pilot MSP and was launched in 2024. The Pilot MSP team is developing a geoportal integrated with the official National Infrastructure for Spatial Data (INDE, in Portuguese) for marine data and establish methodologies to guide the other regions in order to ensure a standardised and cohesive approach to MSP implementation throughout Brazil.
In 2008, Brazil launched its National Spatial Data Infrastructure (INDE) to establish standards and serve as a repository for spatial data. However, INDE faces challenges in handling marine data, particularly three-dimensional and time-varying datasets. Over the past few years, academic initiatives have compiled environmental and human-use data for marine areas. The SDI under development to support MSP is composed of:
PostgreSQL Database Management System (DBMS) hosted in a datacenter, with external and public access;
QGIS plugin PGMetadata, developed by Flanders Marine Institute (VLIZ) was used to create a PostgreSQL metadata structure and add information;
Data layers are publicly accessible for viewing or downloading on SeaSketch , a platform designed for participatory mapping (also see Case Study Box 21);
Users can draw zones on SeaSketch to calculate the intensity of human activities within each zone, as well as ecosystem services and marine habitats.
Metadata stored in PostgreSQL can be exported to the Brazilian official SDI standards (INDE).
Certain layers, such as those representing artisanal fisheries and community-based tourism, require improvement through participatory mapping efforts. SeaSketch Brazil will be used in participatory workshops to validate and enhance spatial data on marine human activities, as well as to draw and discuss spatial zoning.
SeaSketch Brazil is not a geoportal or data repository; it was designed to provide spatial information for stakeholders and support participatory mapping. As the MSP for Southern Brazil progresses, a dedicated geoportal will be developed to store and provide access to MSP data layers.

Figure 23: Schematic methodological approach for MSP SDI in Brazil.
© Tiago B.R. Gandra (*)
For more information please see:
3.2.6 Data maintenance - Data and Information Lifecycle Management
Data and Information Lifecycle Management (DILM) is an approach to systematically govern the data's journey from creation to disposal, ensuring its accuracy, security, and usability throughout its existence. DILM helps establish protocols for data, including how to acquire, access, use and delete data. It can be seen as a policy-based approach to managing the flow of data in an organisation throughout its life cycle across different platforms, systems, and storage media (Govil et al., 2008).
DILM optimises data usage and storage and complies with legal and regulatory requirements related to data retention and privacy. This involves implementing rigorous quality control measures to verify data integrity and consistency, including standardising data formats, validating accuracy, and adhering to metadata standards to provide context and provenance for the data. Data maintenance also manages user access and permissions to guarantee that data is secure and used appropriately through setting up proper access controls, monitoring data usage, and updating permissions as needed.
Data management includes both Data Lifecycle Management and Information Lifecycle Management, which are distinct concepts although often interchangeably used. Data Lifecycle Management (DLM) oversees raw data at the file level, managing files based on type, size, age and storage. Information Lifecycle Management (ILM), on the other hand, manages the individual pieces of data within a file, ensuring that the information contained in the file is still up to date. Both DLM and ILM play crucial roles in data management.
Data maintenance in SDI for MSP is important for reflecting changes in marine environments, evolving ocean use patterns and new scientific discoveries, but also to integrate evolving monitoring techniques and comply with changing regulatory and legal requirements. This enables decision-makers to have access to the most current and precise data and enhances the credibility of the SDI for marine management.
DLM is separated into five key stages based on different criteria, and the data moves through these stages as it completes different tasks or meets certain requirements (Figure 24). Each stage requires specific practices to verify that data remains accurate, accessible, and secure, thus supporting informed decision-making and operational efficiency (Rahul and Banyal, 2020). The key stages of the DLM cycle include the following:
Data Creation and Acquisition: Initial stage where data is gathered or created, capturing relevant information for future use. Effective management during this phase supports data quality and integrity, which is crucial for subsequent stages.
Data Storage, Maintenance and Cleaning: Data is stored in databases or other storage systems for easy access and management. Ongoing procedures are carried out to verify data remains accurate, up-to-date, and secure, including updates and corrections.
Data Use: Data is accessed and analysed to extract valuable insights in support of MSP.
Data Review: Data and information are evaluated regarding accuracy, relevance and quality to make sure it meets required standards and objectives. Decision whether to retain it for future reference, archive it for historical purposes, or securely delete it if no longer needed.
Data Archiving: Data that is no longer actively used but needs to be retained for historical reference or compliance purposes is archived.
Data Disposal: Securely deleting or destroying data that is no longer needed to prevent unauthorised access or misuse.
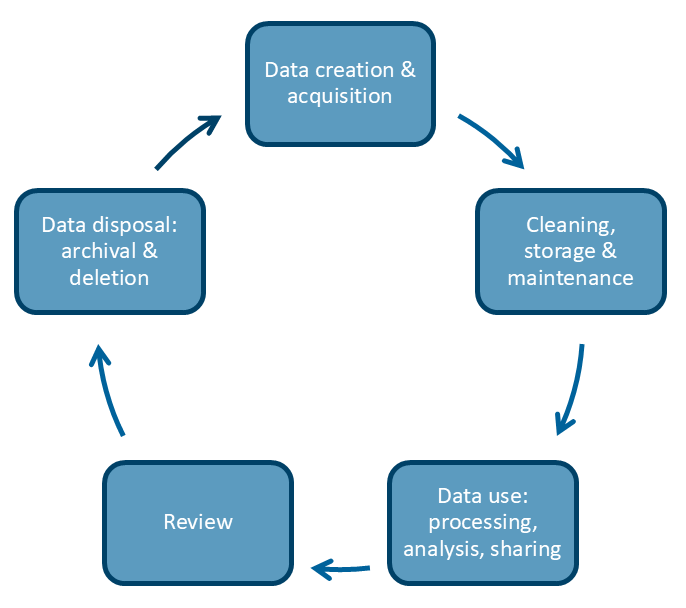
Figure 24: Data lifecycle management cycle with its key stages.
© UNESCO
3.3 Good practices for data
Good practices for data generally aim at ensuring that information is accurate, reliable, and reusable across various applications. These practices involve rigorous data management, adherence to standards, and effective metadata documentation to support informed decision-making and interoperability (Figure 25).

Figure 25: Good practices for data keep the SDI fully operational.
© UNESCO
Good practices for managing data within a Spatial Data Infrastructure (SDI) include adhering to the FAIR data principles, which emphasise making data Findable, Accessible, Interoperable, and Reusable.
Ensuring comprehensive metadata (see Chapter 3.1.2) is crucial for providing context, enabling users to understand and efficiently find and use the data, and supporting interoperability with other datasets and systems.
Data management and quality must be maintained through thorough validation and regular updates to assure accuracy and relevance. Data versioning practices help track changes over time, while the production of clean data supports reliability and tries to minimise errors (see Chapter 3.2.6). Communicating uncertainty in data (see Chapter 3.1.1) helps users assess its reliability and make informed decisions when and how to use such data, and how to interpret results. Employing common geographic data models and georeferencing standards increases interoperability and consistency across different datasets (see Chapter 3.2.4). Maintaining continuous data coverage is essential for providing uniform, gap-free spatial data across the entire area of interest (see Chapter 3.1.1).
Data accessibility and sharing can be facilitated through open access policies and user-friendly platforms, while data discoverability and machine readability enhance usability and integration with other systems. The SDI should be accessible to diverse audiences by offering user-friendly tools, clear documentation, multilingual support, offline access options and accommodations for varying technical expertise (see Chapters 3.2.5 and 4.4).
Strategic data gathering should prioritise data sharing to maximise utility of existing data and reduce duplication of efforts. Forming partnerships and collaborations across organisations can enhance data quality, expand coverage, and support shared objectives (see Chapter 2 Task 7 and Chapter 6.3). Implementing these good practices when designing and maintaining an SDI will support comprehensive and sustainable data management in MSP processes.
The following sections provide more details about each of the topics mentioned, outlining good practices for establishing and managing data within an SDI.
3.3.1 Data principles serving as guidelines for SDIs
FAIR Data principles: “What is the FAIRness level of my MSP SDI?”
The foundational FAIR data principles45 aim at making data more accessible and reusable in the spirit of enhancing research and the vision of Open Science (Wilkinson et al., 2016). These apply to any digital objects in the broad sense of data like datasets, algorithms, ontologies, and metadata describing data.
The principles are explained as several recommendations organised in four elements: Findable, Accessible, Interoperable and Reusable (Figure 26). FAIR data covers the methods for data curation, storage, publication, and data management good practices, to make the data easily Findable, Accessible, Interoperable, and Reusable. The process of making data FAIR involves two parallel workflows: one focused on the content data and the other on the metadata, which, within a data catalogue, acts as a proxy for the content data (Figure 27).

Figure 26: The FAIR data principles and specific recommendations for data management and stewardship.
© UNESCO
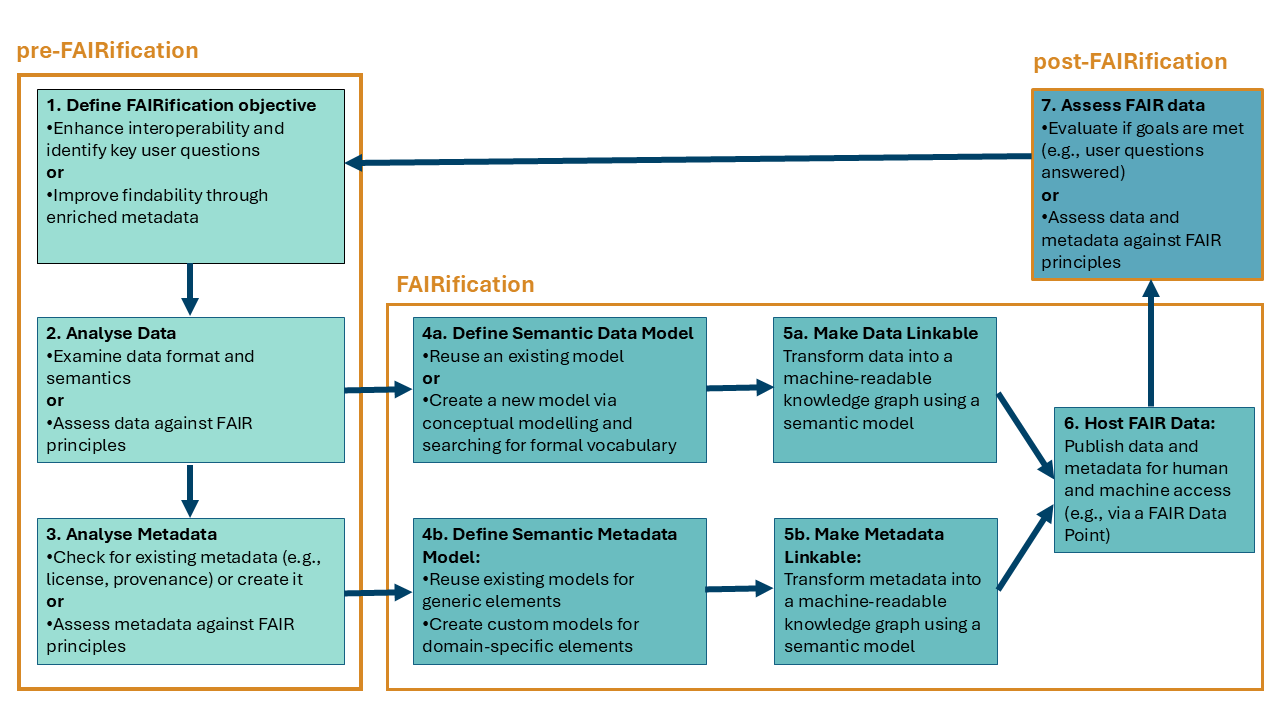
Figure 27: General steps to make a data resource FAIR.
Source: Adapted from Jacobsen et al., 2020
According to its definition (see Chapter 1.3), an SDI embraces the FAIR data principles. The specific capabilities of an SDI that enable it to implement these principles are listed below, with numbered capital letters detailing specific aspects of each of the four main principles:
(i) Findability
F1: Data and metadata are assigned a globally unique and persistent identifier:
The SDI must be able to generate global, dereferenceable, unique and persistent identifiers for its metadata. This requires the implementation of a metadata catalogue.
F2: Data are described with rich metadata (defined by R1 below):
The metadata managed under the SDI must provide attributes answering the following questions about the dataset: What? Why? Who? When? How?
Another good practice consists of adopting an already existing reference standard for the management of the metadata catalogue of the SDI. The Open Geospatial Consortium (OGC) EN ISO 1911546, INSPIRE47 and geoDCAT 2.048 are such reference standards for SDIs. It is important to verify that all metadata attributes are thoroughly populated whenever possible to create rich metadata records. Furthermore, the implementation of a regular revision strategy is key for keeping all metadata updated.
F3: Metadata clearly and explicitly include the identifier of the data they describe:
For instance, DCAT-AP 3.0 has the following property version and version notes to cover this rule. Implementing a robust versioning strategy enables SDIs to better manage their datasets, ensuring they remain accurate, reliable, and useful for a wide range of applications.
F4: (Meta)data are registered or indexed in a searchable resource:
To make a resource searchable, it is important to address how the resource is registered or indexed in the SDI. Technologies like keyword search, faceted search, full-text search, semantic search, GenAI, and geospatial search, which assist users in retrieving data, rely on the technical capabilities of the SDI. For example, an SDI could maintain an endpoint such as GeoSPARQL49, a standard developed by the OGC for representing and querying geospatial data on the Semantic Web. GeoSPARQL extends the SPARQL query language to handle geospatial data, enabling the integration of geographic information with semantic web technologies.
(ii) Accessibility
A1: (Meta)data are retrievable by their identifier using a standardised communications protocol.
A1.1: The protocol is open, free, and universally implementable.
A1.2: The protocol allows for an authentication and authorization procedure, where necessary.
The following examples illustrate the accessibility of principle A1.1:
Human to machine: a resource is referenced by a Digital Object Identifier (DOI)50: The DOI identifier assures that the resource it identifies can always be accessed over the Web using the HTTP/HTTPS protocols. The same applies to an identifier of a metadata record which would be global, defensible, unique and persistent complying to both F1 and A1 principles.
Machine communication using standard protocols: A second example consists of a raster dataset that is retrievable from a standard OGC Web Coverage Service WCS51. Its metadata lists all the OGC services supported by the SDI. The OGC Web Map Service52 provided by the SDI is open, free, and universally accessible over the web, allowing users to visualise the dataset through desktop interactive mapping applications like QGIS. If the visualisation service is open, downloading the dataset via the WCS API is restricted to authenticated users. This decision by the SDI mitigates the performance impact of too many concurrent downloads.
A2: Metadata are continuously accessible, even when the data are no longer available:
An SDI should never delete metadata records created for the data it manages. For example, all data citations in scientific publications must remain accessible. This supports the sustainability of the infrastructure, and the quality of the services provided to the data users.
(iii) Interoperability
In the context of FAIR data principles, interoperability emphasises the use of standardised metadata to make sure that data can be understood and used across different systems and domains. By adhering to common metadata standards and vocabularies, data becomes more easily discoverable and integrable.
All three Interoperability sub-principles are applicable:
I1: (Meta)data use a formal, accessible, shared, and broadly applicable language for knowledge representation.
I2: (Meta)data use vocabularies that follow FAIR principles, such as:
Dublin Core (dct:) to represent metadata.
FOAF (Friend of a Friend) to represent organisations.
PROV to represent provenance and data lineage.
SKOS (Simple Knowledge Organization System) to represent glossaries and therausi.
Using these standardised vocabularies supports making metadata interoperable across different systems and platforms.
I3: (Meta)data include qualified references to other (meta)data.
(iv) Reusability
R1: (Meta)data are richly described with a plurality of accurate and relevant attributes.
R1.1: (Meta)data are released with a clear and accessible data usage licence.
R1.2: (Meta)data are associated with detailed provenance.
R1.3: (Meta)data meet domain-relevant community standards.
The core metadata model can be extended with popular ontologies and controlled vocabularies. To enhance consistency among catalogues such as:
Data Quality vocabulary to describe data quality.
Data Protection vocabulary to describe data privacy.
CSVW to represent tabular data.
In conclusion, the FAIRness level of an SDI can be assessed by identifying a set of key capabilities aimed at making the data FAIR. This assessment can be guided by the questions outlined in Box 16.
Box 16: Checklist - is my data FAIR?
- Does the SDI generate and manage unique identifiers for both data and metadata? Are its identifiers permanent and dereferenceable?
- Does the SDI rely on free and open community standards?
a - For enabling communication with standard protocols such as HTTP/HTTPS and standard APIs like OGC Web Services?
b - Regarding community standards, such as DCAT for metadata, and standards for data models that improve syntactic and semantic interoperability between digital objects, as well as standards for knowledge representation and related areas?
c - Standards for authentications of users.
Is the SDI machine readable and actionable?
Are there any bottlenecks that hinder users from accessing, understanding, and processing/reusing the resources of the SDI?
What search and processing capabilities does the SDI offer? Can SDI resources be effectively searched both internally and through external platforms, such as web search engines?
How user-centric is the SDI? Consider aspects such as well-documented and published Service Level Agreements (SLAs), detailed metadata that clarifies ownership, provenance, and quality, clearly defined usage licences and access conditions, persistent identifiers, and assurances for the long-term availability of resources.
CARE principles
The CARE principles (Global Indigenous Data Alliance, n.d.) –Collective benefit, Authority to control, Responsibility, and Ethics– are a set of principles intended to guide open data projects in engaging with Indigenous Peoples’ rights and interest. They serve as a framework for Indigenous data governance, promoting ethical and responsible data sharing practices.
The following is a summary of the CARE principles for Indigenous data governance:
Collective benefit - Data ecosystems shall be designed and function in ways that enable Indigenous Peoples to derive benefit from the data.
Authority to Control - Indigenous Peoples’ rights and interests in Indigenous data must be recognised and their authority to control such data be empowered. Indigenous data governance enables Indigenous Peoples and governing bodies to determine how Indigenous Peoples, as well as Indigenous lands, territories, resources, knowledge and geographical indicators, are represented and identified within data.
Responsibility - Those working with Indigenous data have a responsibility to share how those data are used to support Indigenous Peoples’ self-determination and collective benefit. Accountability requires meaningful and openly available evidence of these efforts and the benefits accruing to Indigenous Peoples.
Ethics - Indigenous Peoples’ rights and wellbeing should be the primary concern at all stages of the data life cycle and across the data ecosystem.
3.3.2 Data management and quality
Data management and quality are key for MSP initiatives to make sure that decisions are based on accurate, up-to-date, and reliable information. Effective data management helps integrate diverse datasets, keep data up-to-date, and facilitate data accessibility and re-use. Poor data can lead to ineffective planning, environmental harm, and economic inefficiencies, making data quality and management a key aspect for MSP initiatives.
In the context of Large Marine Ecosystem (LME) governance, the LME:LEARN project53 has identified data and information to play a key role in all phases of the policy cycle in international waters, and provides guidance to the LME and MSP community through its LME_LEARN Data and Information Management Task Force (DIM TF) (Box 17).
Box 17: GEF IW:LEARN5 and the Data and Information Management Task Force (DIM TF)
GEF LME:LEARN was a project designed to improve global ecosystem-based governance of Large Marine Ecosystems (LMEs)54 and their coasts by generating knowledge, building capacity, harnessing public and private partners and supporting south-to-south and north-to-south learning. LME:LEARN recognized data and information to play a crucial role in all phases of the policy cycle in international waters, from decision-making via implementation and monitoring, to analysis and recommendations. Data and information support an understanding and greater awareness of environmental issues, causes, sources and impacts; it functions as an on-going component of the development and assessment of management policies, strategies and interventions; it promotes new legislative and policy initiatives for sustainable resource management and pollution prevention; and it facilitates improved enforcement, decision-making and individual action.
GEF IW:LEARN5 is the current project building on the achievements of LME:LEARN. It is supported by the Global Environment Facility (GEF)55, the United Nations Development Program (UNDP)56, the United Nations Environment Programme (UNEP)57 and UNESCO-IOC. To guide and support the data sharing and integration work that will enhance the availability and accessibility of consistent data and indicators on LMEs, as well as integrated coastal management and marine protected areas, the IW:LEARN5 is focusing its efforts on re-establishing the Data and Information Management Task Force (DIM TF). This work builds on the achievements of the DIM Working Group (WG) under LME:LEARN but expands its focus to include both LMEs and freshwater systems. The DIM TF will facilitate learning exchanges on data and information management tools for the broader community of practitioners, providing a variety of documents, manuals, and services to support practitioners with effective guidance.
For more information please see:
Data versioning
Data versioning is crucial for maintaining the integrity and traceability of datasets over time. By implementing robust version control systems, organisations can assure that any changes or updates to the data are meticulously documented. This practice not only aids in tracking the evolution of the data but also allows users to revert to previous versions if necessary. Effective data versioning practices contribute to the reliability and credibility of the datasets, supporting informed decision-making and analysis.
Production of clean data
Producing clean data is fundamental for accurate analysis and decision-making. Clean data is free from errors, inconsistencies, and redundancies, making it more reliable and usable. Data cleaning involves several processes such as validation, correction, and standardisation. By ensuring data quality from the outset, organisations can avoid the pitfalls of inaccurate analyses and the propagation of errors through datasets.
Clean data supports robust analytical processes and enhances the overall quality of insights derived from the data, which is critical for fields such as marine spatial planning, environmental monitoring, and resource management.
Communicating uncertainty
While the concept of clean data is an ideal, it is common for marine plans to be based on the ‘best available data’ rather than wait for ideal data to become available. Therefore, it is crucial to quantify and effectively communicate data uncertainties and limitations. This can be achieved by integrating descriptions of uncertainty information into the metadata, such as describing data quality metrics or limitations. Additionally, it can be useful to visually mapping uncertainty to visualise areas of high and low quality or source data availability if resources permit.
By transparently communicating these aspects, organisations support that users interpret data insights with the appropriate context and understand decision risks leading to more reliable and trustworthy decision-making processes. Identifying limitations and quality issues also provides the information needed to guide strategic improvements.
For detailed information on quantifying, mapping, and communicating data uncertainties, please see item Addressing Data Uncertainties in Chapter 3.1.1.
Use common geographic data models
Using common geographic data models is essential for ensuring consistency and interoperability across different datasets. Standard geographic data models, such as those defined by the United Nations58, ISO59, the IHO60 or the European INSPIRE Directive61 provide a framework for representing spatial information in a uniform manner. This standardisation allows datasets from different sources to be integrated and compared, facilitating comprehensive spatial analysis. Common data models support various applications, including mapping, spatial analysis, and geographic information systems (GIS), enhancing the usability and accessibility of spatial data.
Georeferencing
Georeferencing involves assigning spatial coordinates to data, enabling it to be accurately placed on a map. This process is critical for ensuring that datasets can be used in spatial analyses and integrated with other geospatial data. By georeferencing data, planners can make sure that different datasets align correctly and can be analysed together, providing a solid foundation for spatial planning and decision-making. Use of consistent Coordinate Reference Systems (CRS) and integration of related datasets guarantees that spatial data is uniformly referenced across different geographic and jurisdictional boundaries.
Continuous data coverage
Continuous coverage refers to aiming for spatial data that thoroughly and consistently covers the entire area of interest without any gaps which is essential for MSP. Achieving continuous coverage involves using spatial modelling techniques such as interpolation and predictive habitat mapping, which fill gaps and generate continuous data from irregular and location-specific sources. For example, bathymetric data might be interpolated to provide seamless depth information across the planning area (Box 18), and predictive models can map habitats based on sampled data points. Ensuring continuous coverage provides planners with uniform and reliable information across the entire geographic area, supporting effective marine spatial planning and resource management.
Please see Chapter 3.1.1 for more details about spatial and temporal data coverage.
Box 18: The General Bathymetric Chart of the Oceans (GEBCO) project
The General Bathymetric Chart of the Oceans (GEBCO)62 project is a global initiative focused on mapping the seafloor and producing the most comprehensive and authoritative bathymetric data available. It is a joint effort between the International Hydrographic Organization (IHO) and UNESCO-IOC. GEBCO's mission is to provide high-resolution maps of the world's ocean floors, supporting scientists, policymakers, and marine industries in better understanding ocean dynamics, hazards and resources. One of its key achievements is the creation of global bathymetric grids, which are used for various applications such as navigation, environmental monitoring, and deep-sea research.
The GEBCO project also plays a critical role in global ocean governance, supporting sustainable development goals and international efforts to protect marine environments. Its ongoing initiative, the Seabed 2030 project63, aims to map the entire seafloor by 2030, a key step in improving ocean knowledge. By pooling data from various sources, including scientific expeditions, hydrographic surveys, and contributions from private and public sectors, GEBCO continuously enhances the understanding of marine topography.

©Metamoreworks/Shutterstock.com (*)
3.3.3 Data accessibility and sharing
SDI accessibility – inclusion of diverse audiences
SDIs must be accessible to a diverse audience to maximise their utility and impact. This includes not only technical experts and researchers but also policymakers, educators, and the general public.
Ensuring broad accessibility involves using user-friendly interfaces, providing clear documentation, and supporting multiple languages. Additionally, accommodating various levels of technical expertise and ensuring data is available in formats that are accessible to all users can significantly enhance the inclusiveness and usability of SDIs.
An important aspect of this inclusivity is the consented inclusion of cultural and Indigenous datasets as well as language translation. This makes sure that Indigenous and local knowledge as well as cultural heritage are respected and included in spatial planning processes, as well as that the SDI can be used by IPLCs (see Chapters 3.3.1 and 6.4 for more details). Moreover, in situations where there is a digital divide, it is crucial to provide options for extracting materials for offline use or in hard copy. This supports those with limited or no internet access to still benefit from the data.
Inclusive SDIs support broader participation in data-driven decision-making, foster greater public engagement in environmental and spatial planning, and acknowledge the valuable contributions of Indigenous communities to sustainable management practices.
Please see Chapters 3.2.5 and 4.4.2 for more information about data accessibility.
Formation of partnerships and collaborations
Forming partnerships and collaborations with other organisations is crucial for expanding the reach and impact of data initiatives (Box 19). Collaborative efforts can lead to the pooling of resources, expertise, and data, enhancing the overall quality and scope of available datasets. Partnerships can facilitate the sharing of good practices, the development of common standards, and the integration of diverse data sources. These collaborations can be particularly beneficial in addressing complex, multifaceted issues that require interdisciplinary approaches and comprehensive data inputs. By working together, organisations can achieve more significant and impactful outcomes in data-driven projects.
Please see Chapters 6.1 and 6.3 for more details about frameworks and data sharing in the context of partnerships and collaboration.
Case Study
Box 19: The need for reliable, accessible, and interoperable spatial data for effective MSP in Pacific Island countries
Contributed by Sally Bailey, Kishan Kumar and Hans Wendt
The MSP projects led by The Pacific Community (SPC) support Pacific Island countries to sustainably manage ocean spaces by balancing ecological, social, cultural, and economic priorities. Working with regional and national partners, the projects help governments to develop integrated ocean management (IOM) through participatory planning, spatial data analysis, and capacity development. It focuses on data sharing, governance and enhancing access to spatial data via platforms like the Pacific Data Hub (PDH) and applying decision-support tools (DST). The project ultimately aims to support resilient, inclusive, and science-based ocean governance aligned with national priorities, regional ocean strategies and global commitments.

Figure XX: Stakeholder engagement for MSP process in Palau.
© SPC/Sally Bailey (*)
SPC currently has components of an SDI for MSP in the Pacific which intends to provide the digital framework and tools needed to collect, manage, share, and use geospatial data for IOM. It will enable governments and stakeholders to access reliable, up-to-date spatial information critical for evidence-based decision-making.
Built around the PDH platform and supported by repositories like Nexus, this SDI should ensure that data will flow efficiently from collection to planning and policy application.
The main features of the SDI include the following components:
Pacific Data Hub (PDH): Central, open-access platform hosting environmental, ocean, socio-economic datasets and provides visualisations. The PDH harvests data from reliable platforms.
Nexus geospatial data repository: Secure, version-controlled environment for managing sensitive or large spatial datasets and analytical models.
Global standards and metadata: Harmonised metadata protocols support interoperability and transparency.
Data sharing and integration: Based on data sharing conditions could facilitate collaboration across organisatons, countries, and sectors, with links to tools like Marxan and QGIS.
National alignment: Potential to support and harvest data from national portals (e.g. PALARIS in Palau https://palaris-palaugis.hub.arcgis.com/) and integrate with national planning systems.
Capacity development: Accompanied by knowledge exchange and technical support to ensure sustained use.
This SDI could underpin MSP efforts by making spatial data accessible, usable, and impactful at both national and regional levels.
Next steps to improve the SDI include the following:
The intention is to have a fully operational SDI based on either open source or proprietary solutions.
Assessing national data infrastructure to ensure countries improve their hosting, management, and control their own MSP-relevant datasets.
Enhancing integration between Nexus and PDH, streamlining data workflows from secure storage to public access.
Developing user-friendly data visualisation tools within PDH to support stakeholder engagement and decision-making.
Improving metadata data quality and governance protocols across global and regional datasets.
Providing ongoing training in data management, GIS, and SDI governance to build long-term national capacity.
For more information please see:
The Pacific Data Hub webpage https://pacificdata.org/
The Nexus Data Portal: https://geonode.pacificdata.org/#/
Data throughput refers to the amount of data that can be transmitted, processed or accessed within a given time, usually measured in units like bits, bytes or megabytes per second. It reflects how efficiently the SDI handles data flow between servers, services and users.↩︎
https://maritime-spatial-planning.ec.europa.eu/msp-resources/technical-expert-group-teg-data-msp↩︎
https://goosocean.org/what-we-do/framework/essential-ocean-variables/↩︎
All MSPglobal publications are available on: https://www.mspglobal2030.org/resources/msp-global-documents/↩︎
https://pro.arcgis.com/en/pro-app/latest/tool-reference/3d-analyst/how-kriging-works.htm↩︎
https://vasab.org/wp-content/uploads/2019/04/Guidelines-on-transboundary-MSP-output-data-structure-ADOPTEDbyVASAB__HELCOM.pdf↩︎
https://www.marsp.eu/media/files/61/marspwp5d51mspinspiredatamodel.pdf↩︎
https://iho.int/en/s-100-universal-hydrographic-data-model↩︎
https://registry.iho.int/productspec/view.do?idx=73&product_ID=S-122&statusS=5&domainS=ALL&category=product_ID&searchValue=↩︎
https://desktop.arcgis.com/fr/arcmap/latest/tools/space-time-pattern-mining-toolbox/create-space-time-cube.htm↩︎
Schema.org is a collaborative, community activity with a mission to create, maintain, and promote schemas for structured data on the Internet, on web pages, in email messages, and beyond: https://schema.org/↩︎
https://ckan.org/ - CKAN is an open-source data management system for powering data hubs and data portals that facilitates publishing, sharing and use of data.↩︎
https://maritime-spatial-planning.ec.europa.eu/practices/data-specification-maritime-spatial-planning-inspire-data-model↩︎
https://knowledge-base.inspire.ec.europa.eu/publications/inspire-metadata-implementing-rules-technical-guidelines-based-en-iso-19115-and-en-iso-19119_en↩︎